Overview
Think of the Questionnaire Report as your project's personal data assistant - always on, always organized, and ready to tell you exactly who's engaged, who's pending, and who needs a nudge. Every questionnaire you've ever sent lives here: trackable, filterable, and exportable, turning raw responses into something you can actually act on.
Getting There
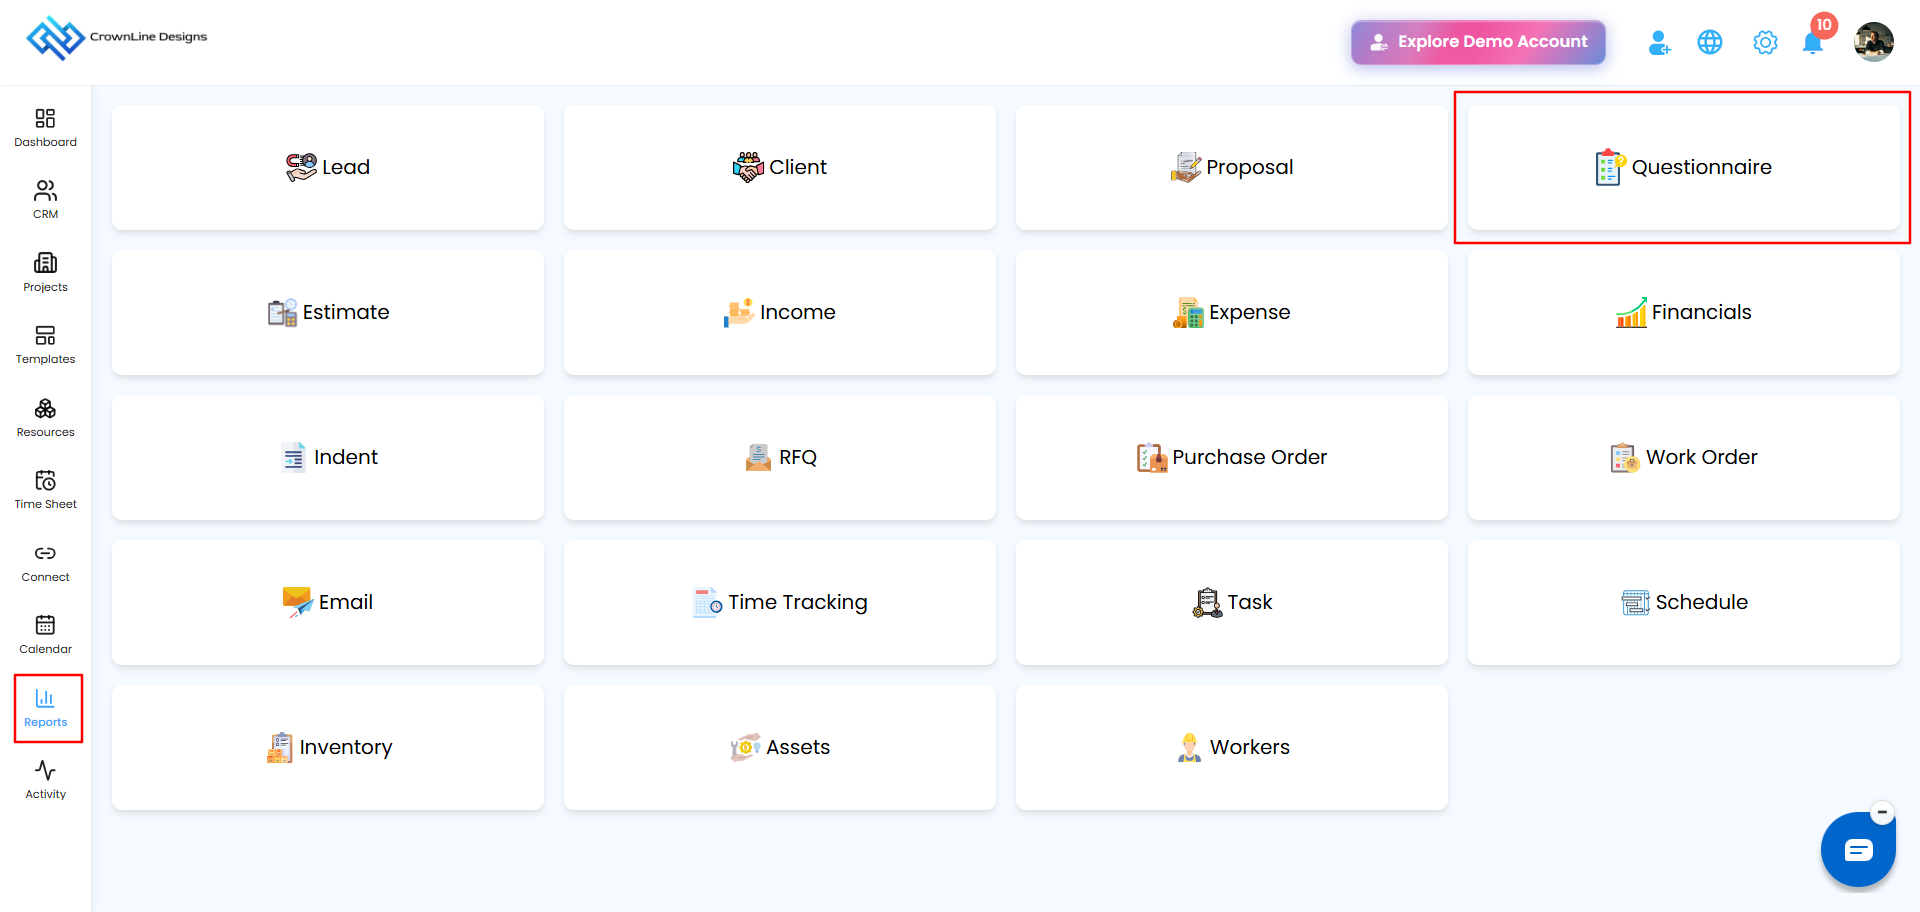
- Go to Reports from the main menu.
- Select Questionnaire Report to open the dashboard.
Dashboard at a Glance
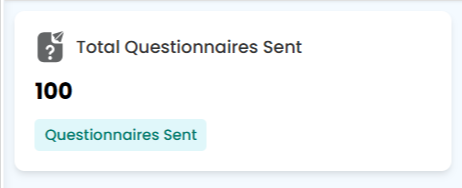
At the top of the page, a quick-glance metric gives you the pulse of your outreach:
- Total Questionnaires Sent -.every questionnaire dispatched from the system, counted for you.
Filtering Your Results
No endless scrolling required. Narrow things down with:
- Project Name - the project linked to the questionnaire
- Sent On - a specific date or date range
Click Apply to filter, or Clear to reset and see everything again.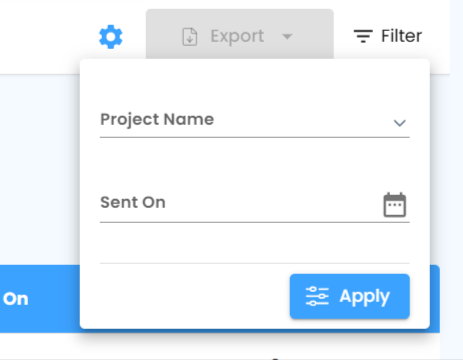
The Questionnaire Table
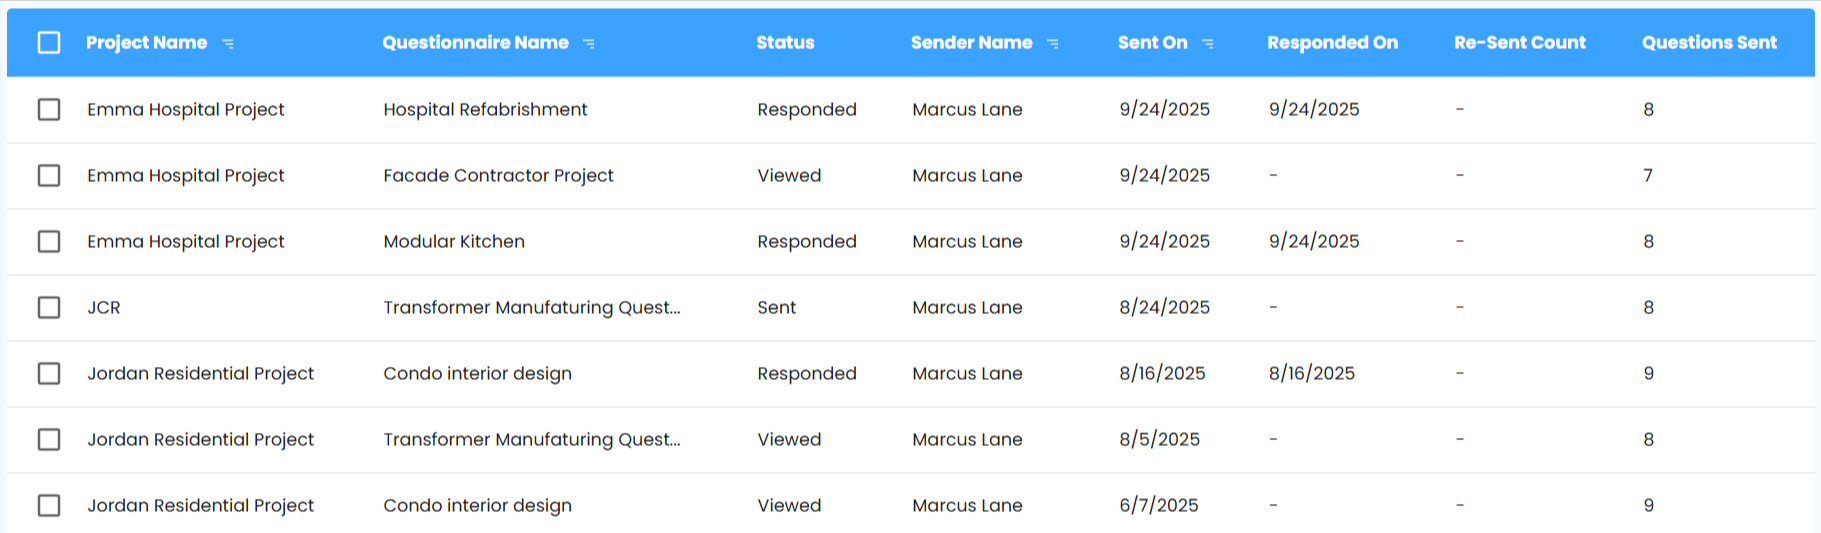
This is where the full detail lives. Each row shows:
| Column | What It Tells You |
|---|---|
| Project Name | The project linked to the questionnaire |
| Questionnaire Name | Its title |
| Questionnaire Status | Sent, Viewed, or Responded |
| Sender Name | Who sent it |
| Sent On | When it went out |
| Responded On | When the recipient opened or responded to it |
| Resent Count | How many times it's been resent |
| Total Questions | How many questions it includes |
Bulk Selection and Export
Use the checkboxes to select multiple questionnaires at once (or "Select All" when you're working through a large list), and apply actions like export in a single move.
Click Export to download the data as an Excel file - perfect for offline review, sharing with stakeholders, or deeper analysis.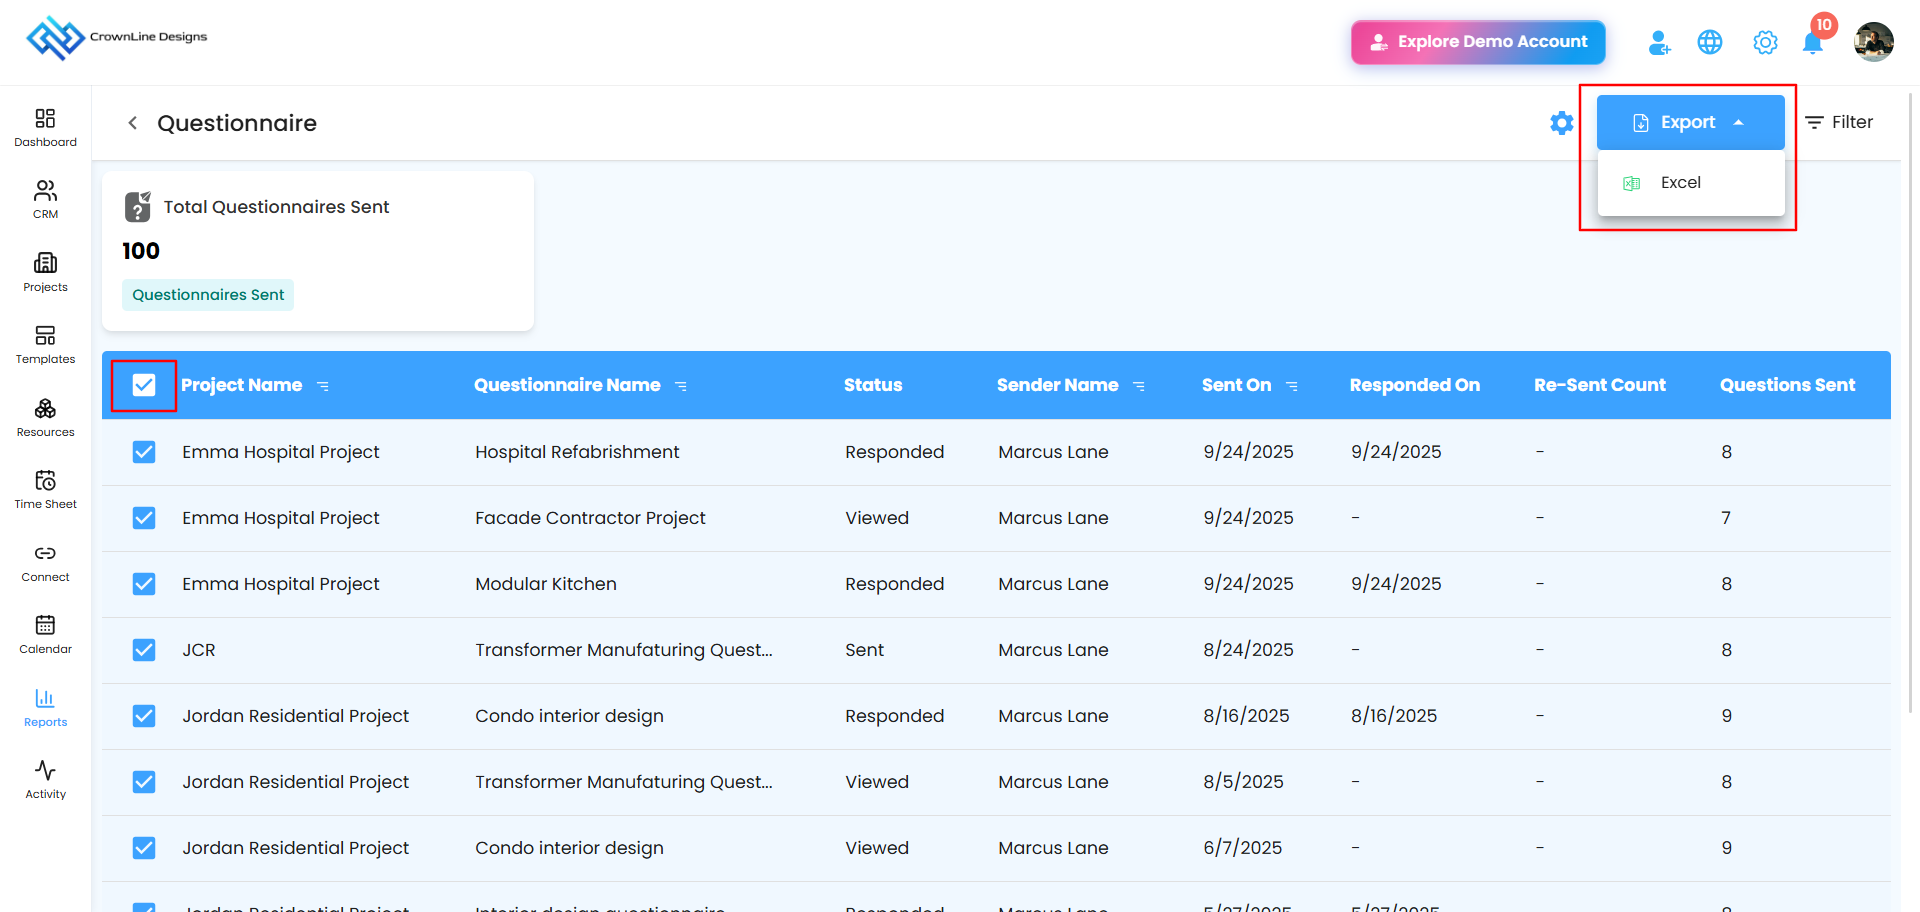
Automating Your Reports
Set it up once, and let it run itself from there - no need to remember to check in manually.
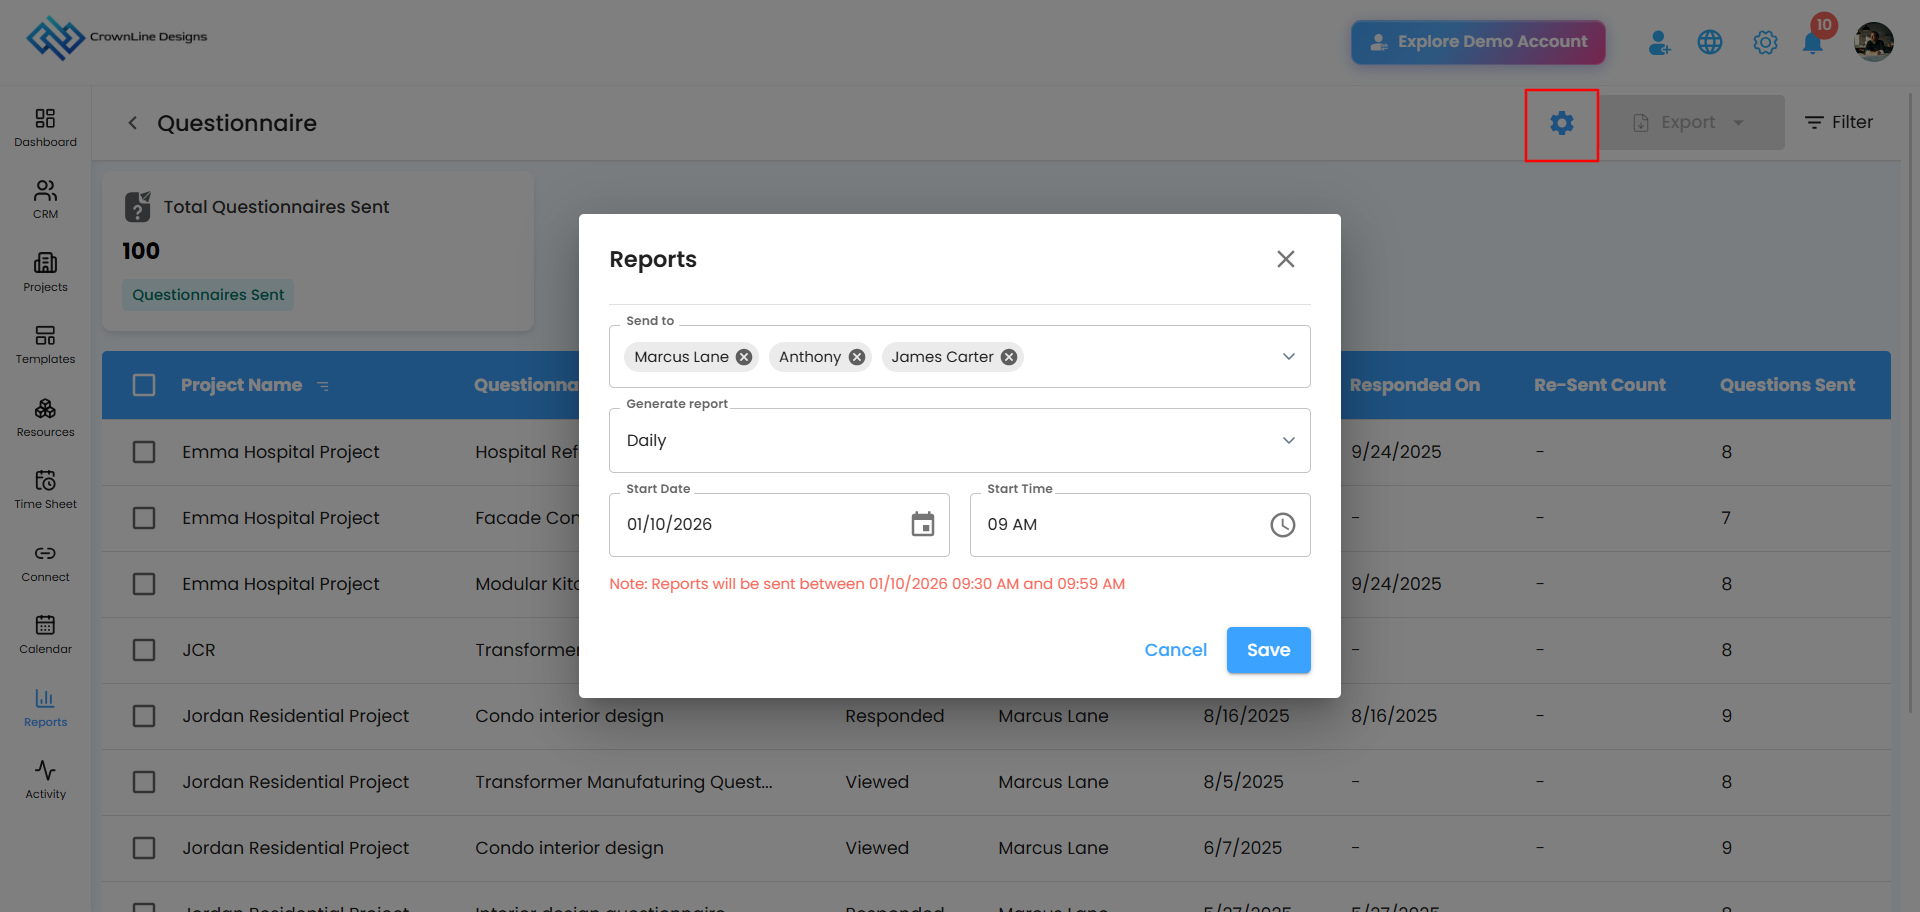
- Click the Configure Report Automation icon on the Questionnaire Report screen.
- Under Send To, choose who should receive the report.
- Under Generate Report, pick how often it goes out:
- Daily (default) - fresh data every day. Set it for 6:00 PM, and it'll land by 6:59 PM.
- Weekly - a full week's worth of activity, delivered on the same day and time each week.
- Monthly - a big-picture snapshot, delivered on the same day and time each month.
- Set the Start Date & Time for the first report to go out.
- Click Save to activate it, or Cancel to discard your changes.
Related Articles
Was this article helpful?
That’s Great!
Thank you for your feedback
Sorry! We couldn't be helpful
Thank you for your feedback
Feedback sent
We appreciate your effort and will try to fix the article