Revenue Dashboard – IntoAEC
The Revenue Dashboard in the IntoAEC application is your financial control tower. From one place, you can monitor revenue performance, project statuses, client conversions, invoices, expenses, and profits — all tied together with interactive visuals and smart insights.
This isn’t just a dashboard — it’s your financial compass, guiding you through business decisions with clarity and precision.
Project:
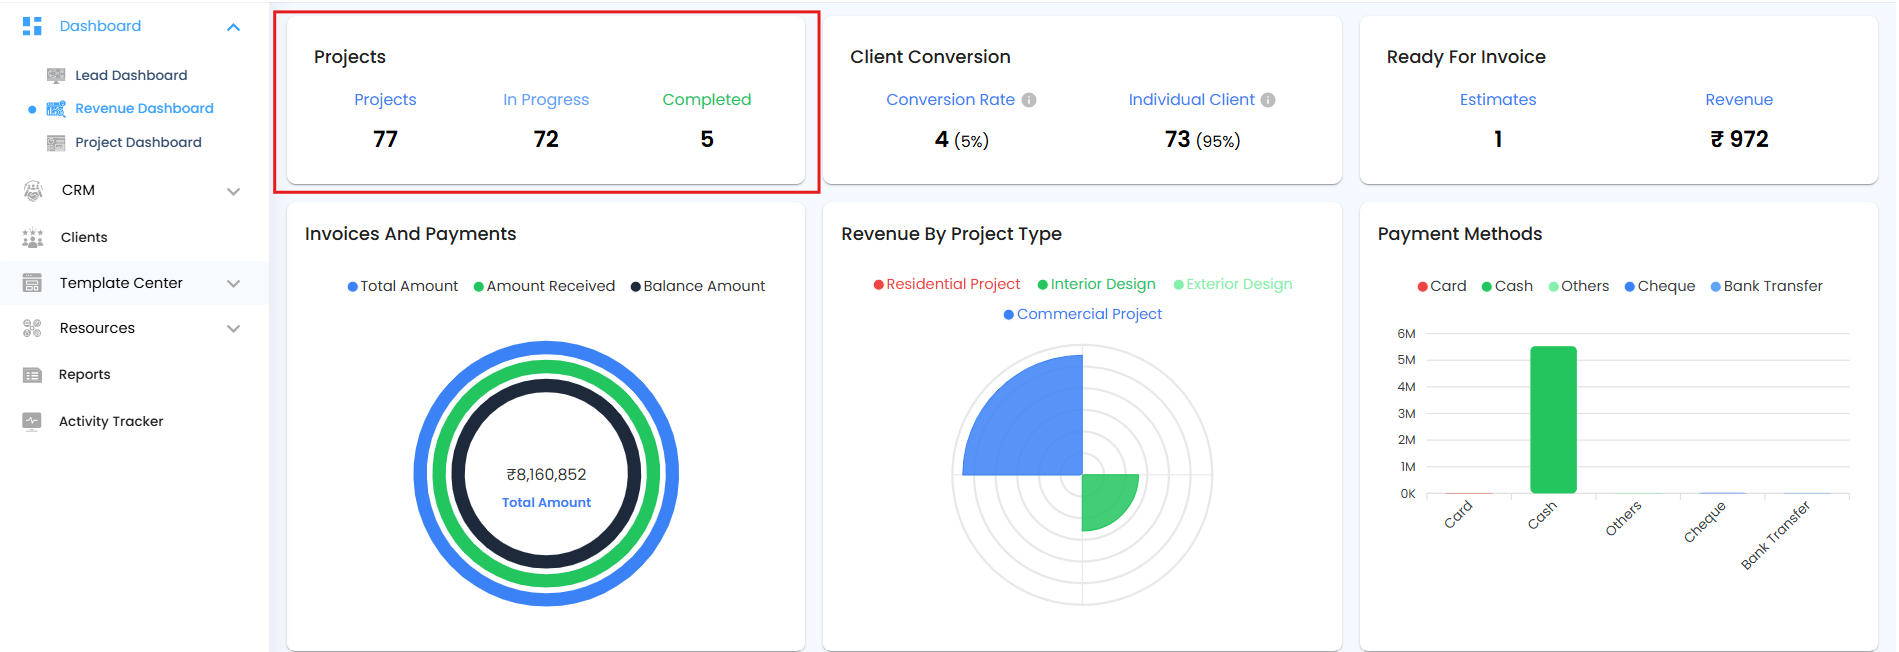
The Project Card offers a breakdown of the current project status within your organization. It includes the following details:
Total Projects: Displays the overall count of projects in the system.
In Progress: Shows the number of projects that are currently active and ongoing.
Completed: Indicates how many projects have been successfully completed.
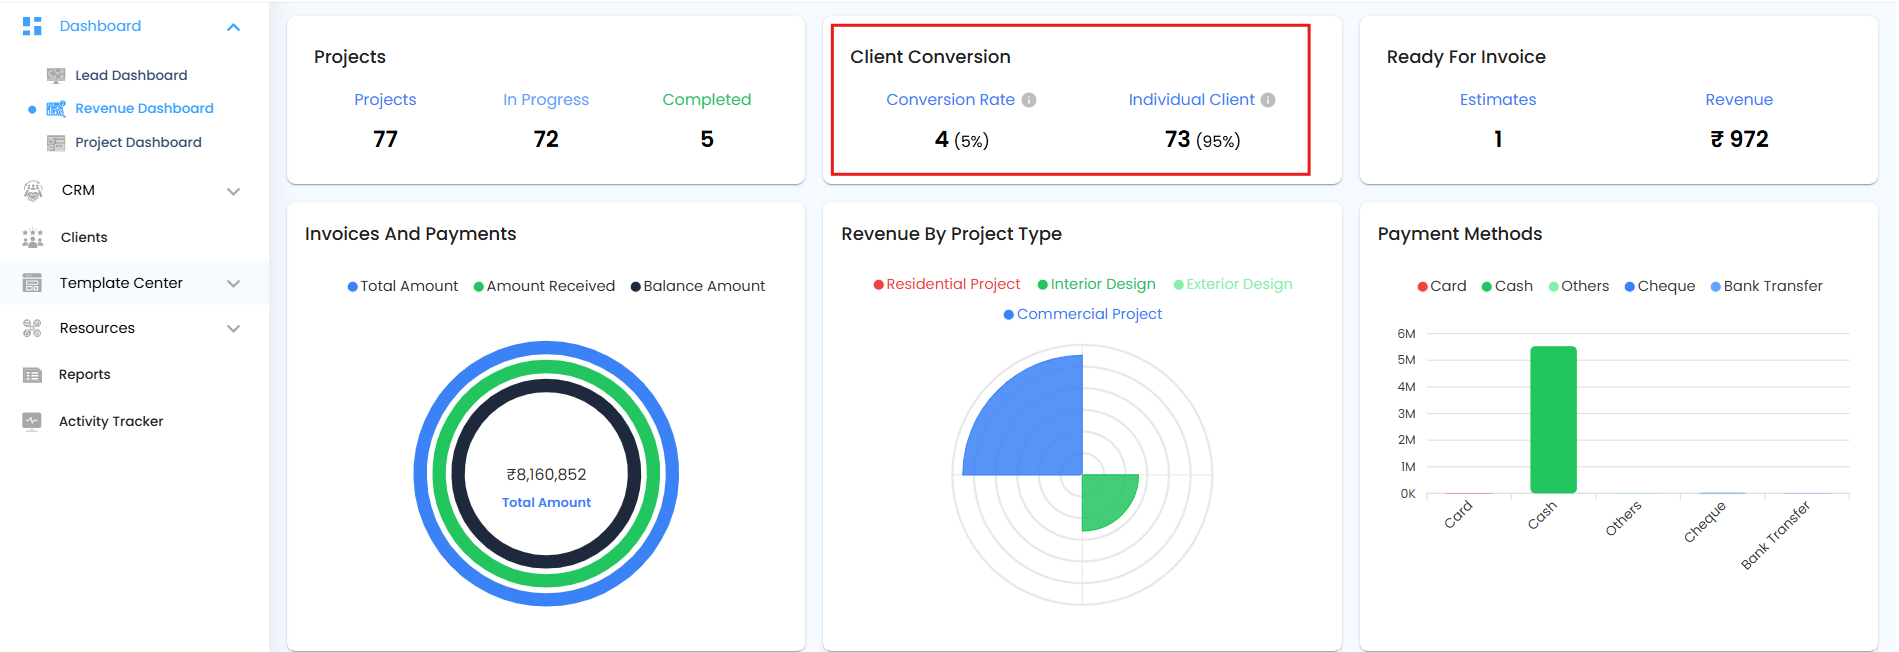
Client Conversion:
Lead to Client Conversion: Displays the number of leads that have been successfully converted into clients, along with the corresponding conversion percentage. This helps you evaluate how effectively your leads are turning into actual business.
Manually Added Clients: Shows the number of clients who were added directly into the system (without conversion from a lead), along with their percentage share of the total client base.
 Ready for Invoice
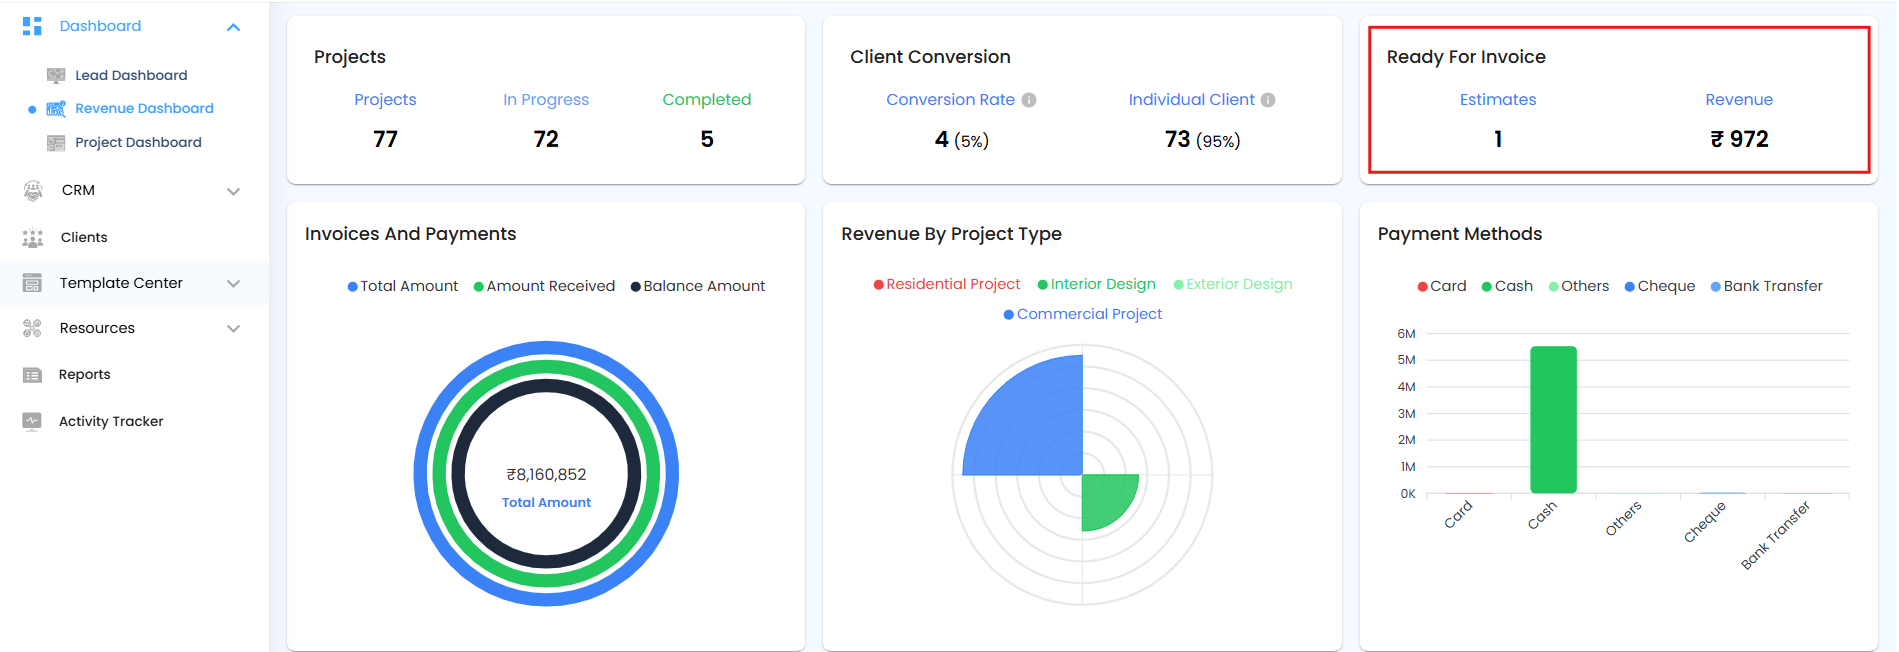
The Ready for Invoice Card displays key financial data related to estimates that are eligible for invoicing. It includes:
Estimate Count: Shows the total number of accepted estimates that are marked as ready to be converted into invoices.
Estimated Revenue: Displays the total revenue value associated with these accepted estimates.
 Invoice and Payment
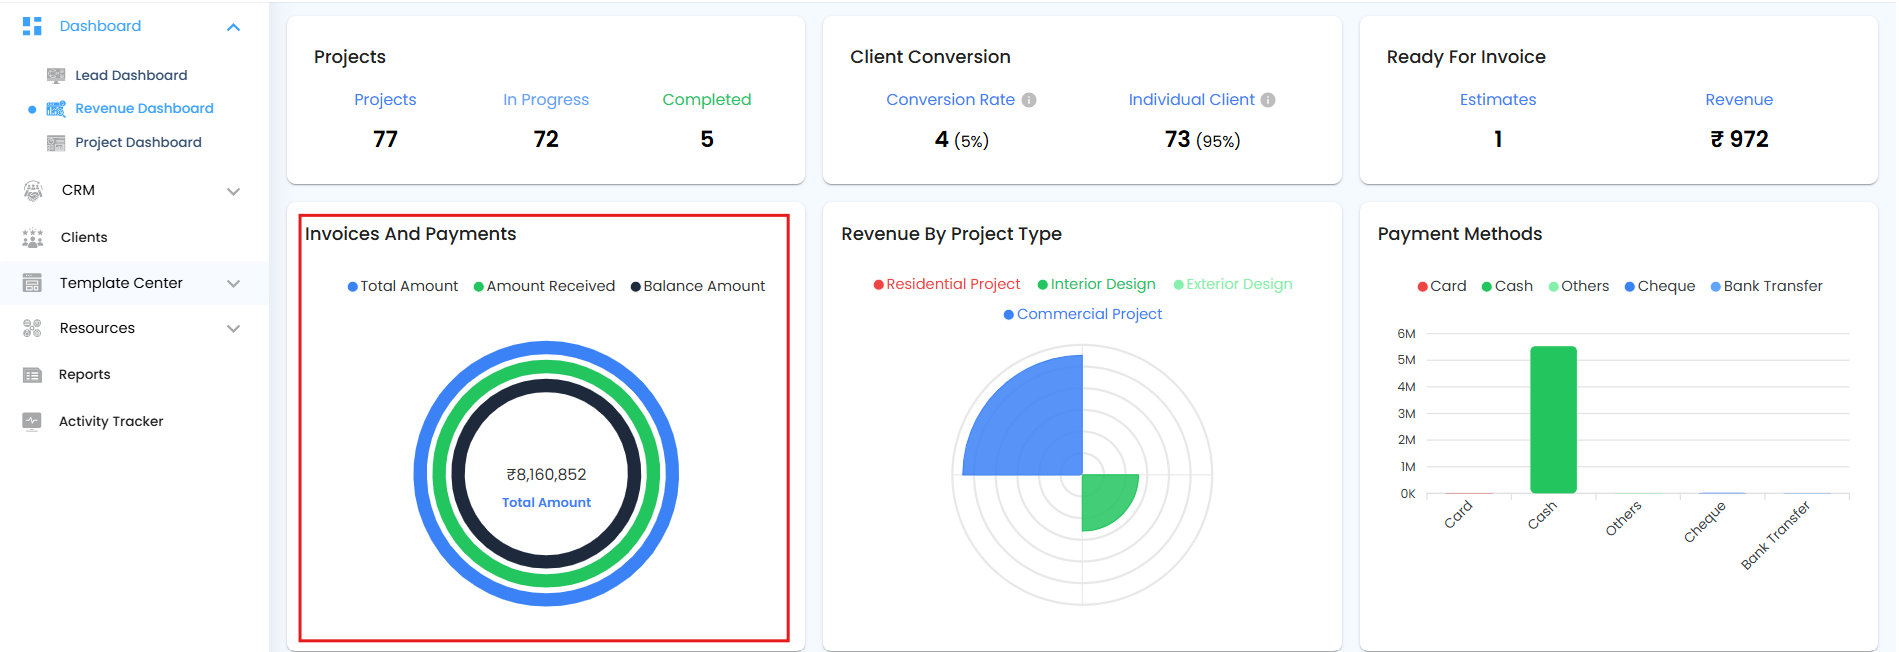
The Invoice and Payment Card provides an overview of your organization's invoicing and payment status across all projects. It displays the following key financial metrics:
Total Amount: The complete value of all invoices generated.
Amount Received: The total payment received from clients against those invoices.
Balance Amount: The remaining amount yet to be collected (Total Amount - Amount Received).
 Revenue by Project Type
The Revenue by Project Type Pie Chart displays the distribution of revenue based on the total invoice amounts for each project type. This helps you quickly understand which types of projects contribute the most to overall revenue.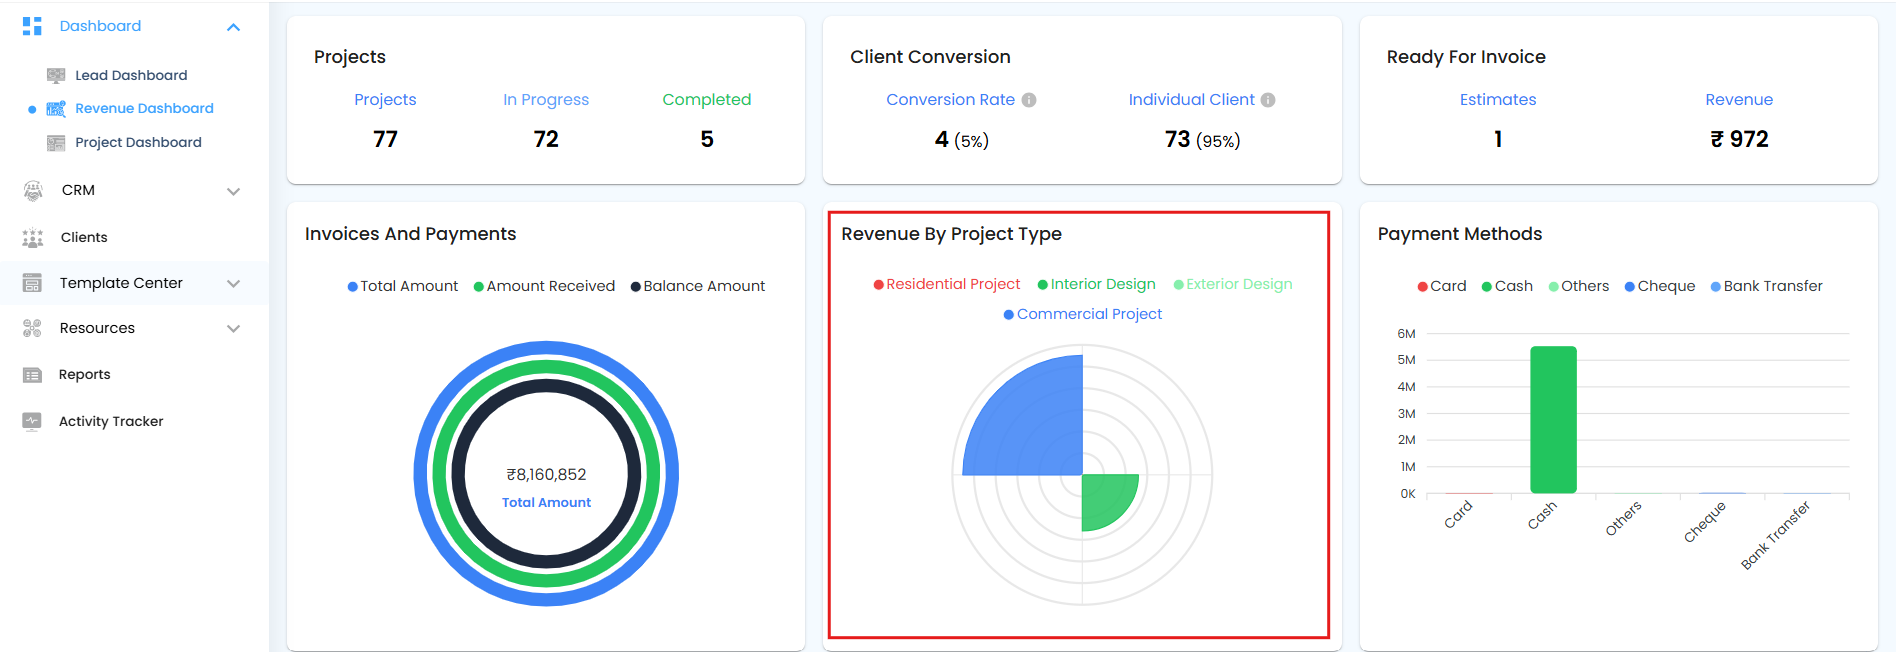
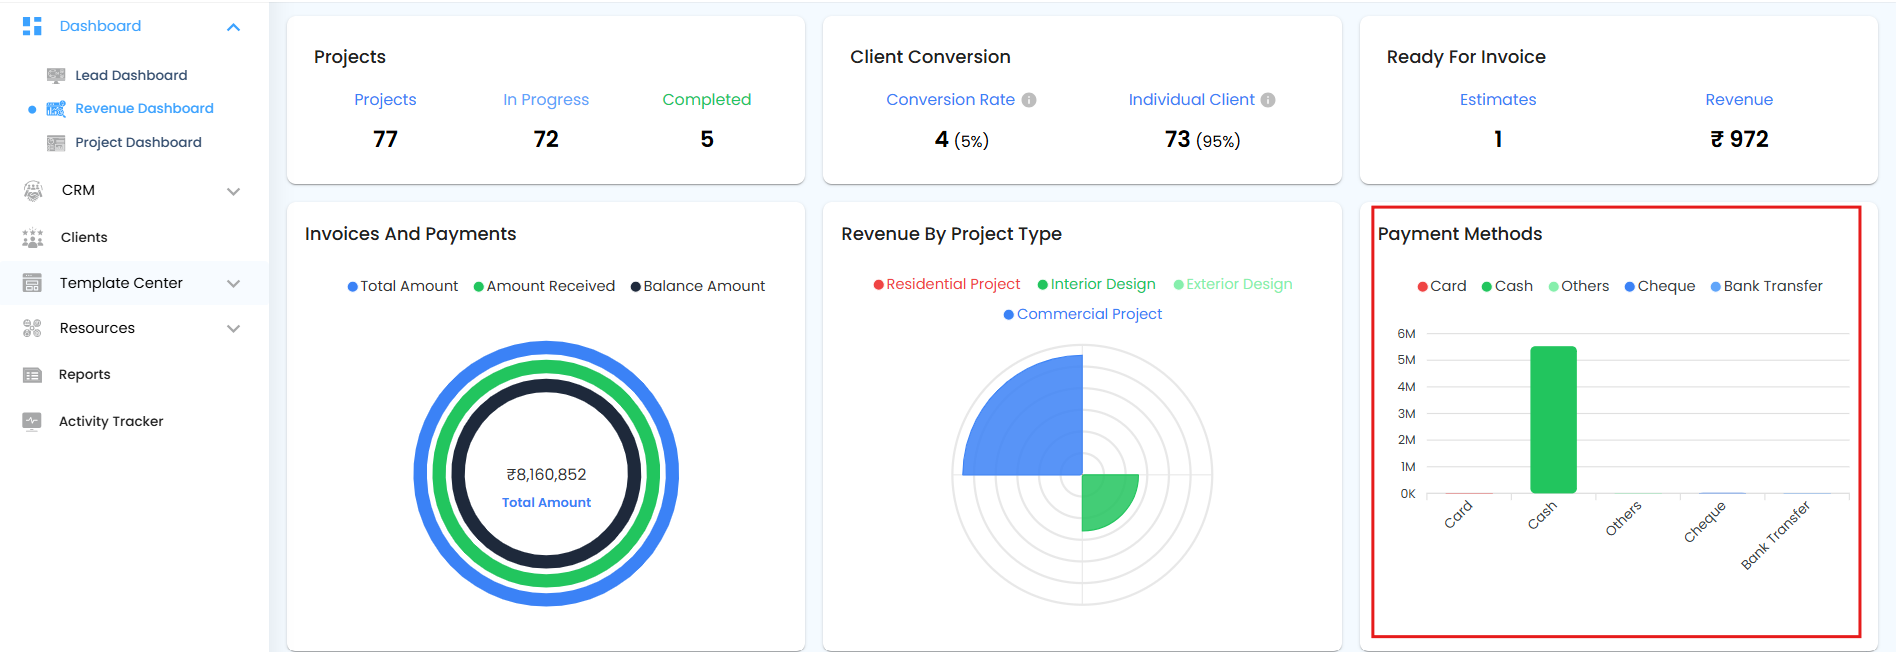
Payment Methods
The Payment Methods Bar Graph provides a visual breakdown of how payments were received for issued invoices across all projects. It displays the total amount collected through each of the following payment methods:
Card – Payments made using credit or debit cards.
Cash – Amounts paid in cash.
Cheque – Payments made by cheque.
Bank Transfer – Amounts transferred directly via bank transactions.
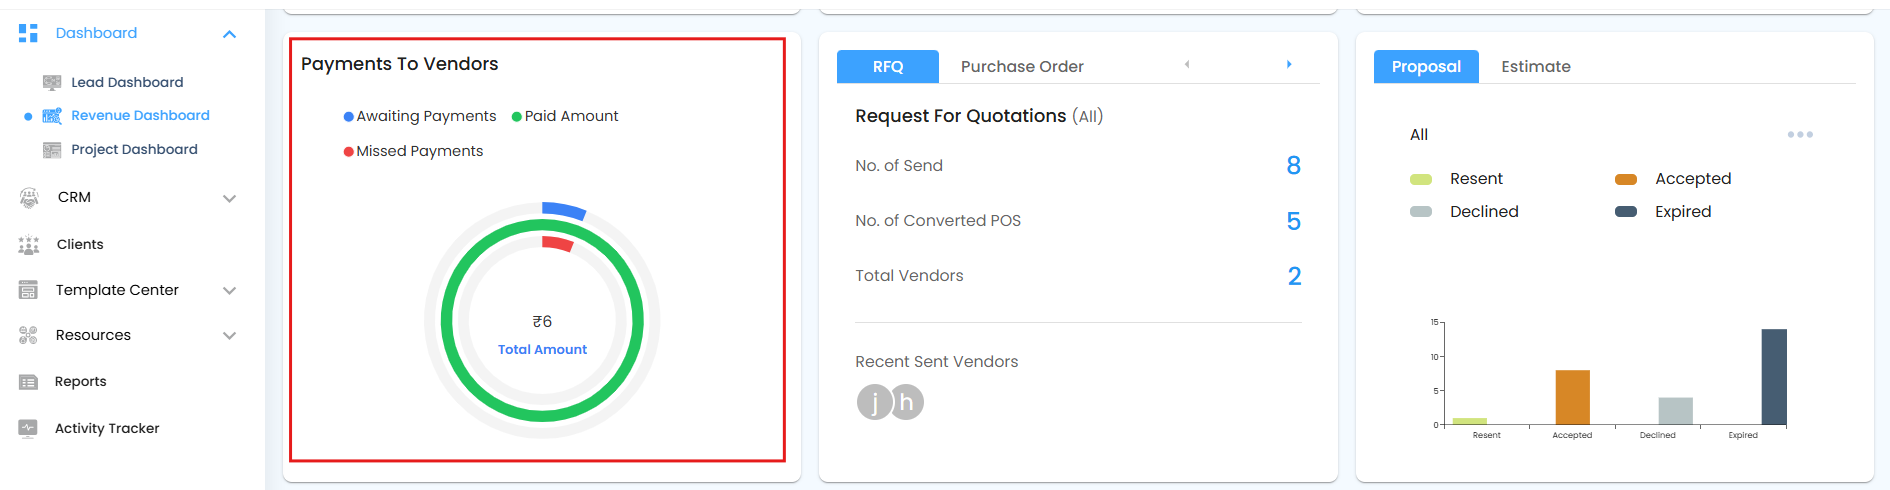
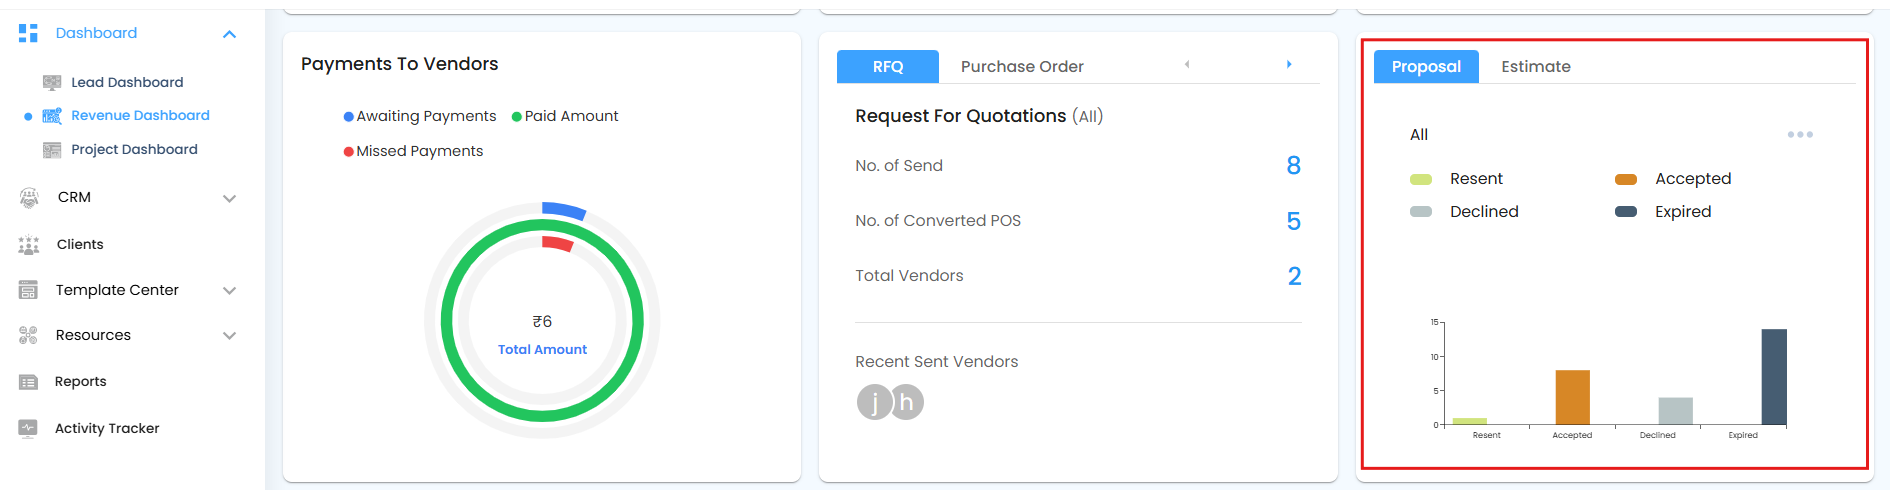
 Payment to Vendors:
The Payment to Vendors Pie Chart provides a visual summary of payments made to vendors based on the invoices they send to the architect. The chart helps track the financial status of vendor-related payments and includes the following key indicators:
Total Amount: Displayed at the center of the pie chart, representing the total value of vendor invoices.
Amount Paid: The portion of the total that has already been paid to vendors.
Awaiting Payments: The amount that is still pending and yet to be paid.
Missed Payments: Payments that have not been made within the defined payment schedule, indicating delays.
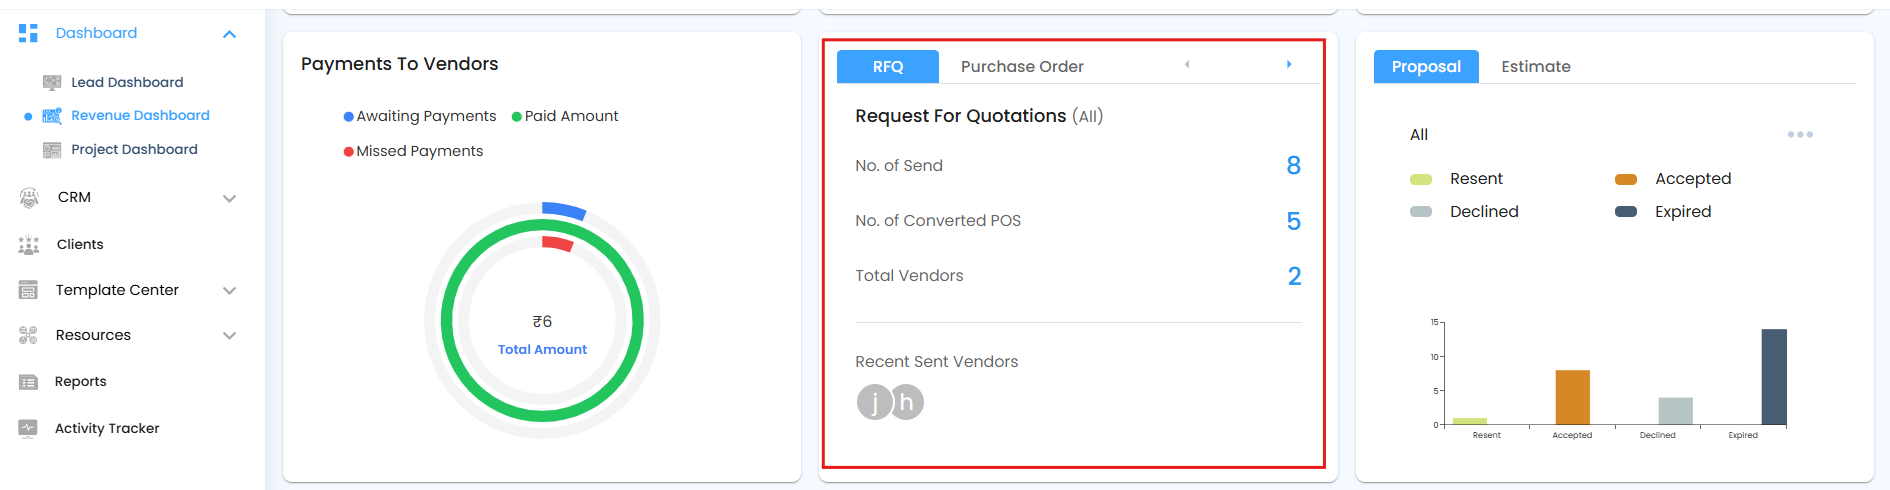
 RFQ/PO
The RFQ/PO Switch Card provides a summarized view of the Request for Quotation (RFQ) and Purchase Order (PO) activity within the system. This card allows you to switch between RFQ and PO views and includes the following key data points:
Number of Sent RFQs: Displays the total count of RFQs that have been sent to vendors.
Number of Converted POs: Shows how many of those RFQs have been successfully converted into Purchase Orders.
Total Vendors Sent: Indicates the number of unique vendors to whom RFQs have been sent.
Recent Sent Vendors: Lists the most recently contacted vendors through RFQs.
 Proposal/Estimate
The Proposal/Estimate Switch Bar Graph provides a visual summary of both proposals and estimates, allowing users to switch between the two using a switch. It displays the count of documents under the following statuses:
Resent – Proposals or estimates that have been resent to the client.
Accepted – Documents approved by the client.
Declined – Documents that were rejected.
Expired – Proposals or estimates that expired without a client response.
This card also includes time-based filters that apply to each status:
All – Displays the total count of resent, accepted, declined, and expired items across all time.
Today – Displays the count of proposals or estimates marked as resent, accepted, declined, or expired specifically on the current day.
This Week – Displays status data specific to the current week.
This Month – Shows the status breakdown for the current month.
 Revenue, Expense, and Profit
The Revenue, Expense, and Profit Bar Graph provides a visual comparison of your organization's financial performance across all projects. This graph displays:
Revenue – Calculated based on the invoices sent by the architect to the client.
Expenses – Includes multiple sources of project-related spending, such as:
Expenses manually added to the system
Time tracked through timesheets that has been converted into billable expenses
Inventory items that were converted into expenses
Amounts paid to vendors based on their submitted invoices
Profit – Automatically calculated as the difference between revenue and expenses.
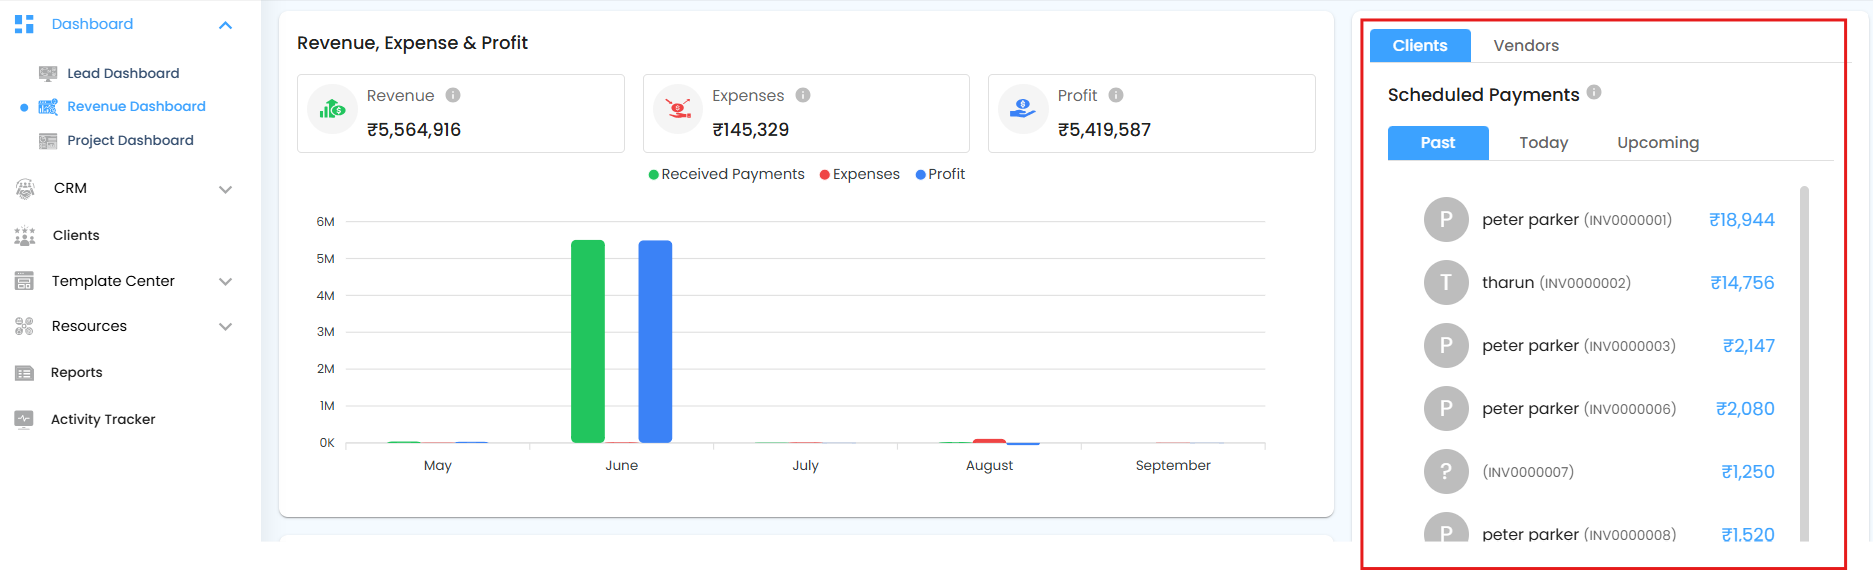
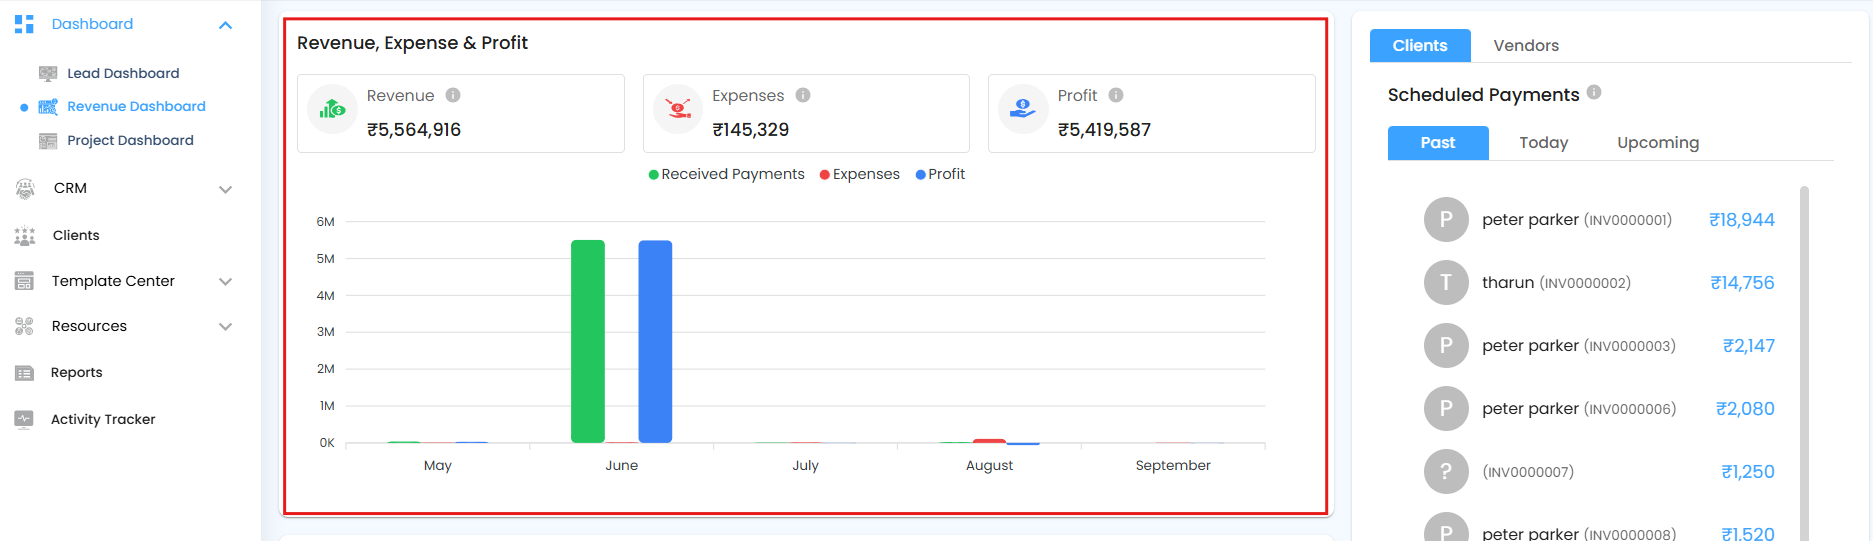 Clients/Vendors
The Clients/Vendors Schedule Payment Switch section allows you to switch between scheduled payments for client invoices and vendor invoices. The invoices are categorized based on their scheduled payment dates into the following segments:
Past – Invoices with scheduled payment dates before today. These may be completed or overdue.
Today – Invoices with payments scheduled for the current day.
Upcoming – Invoices with payments scheduled for future dates.
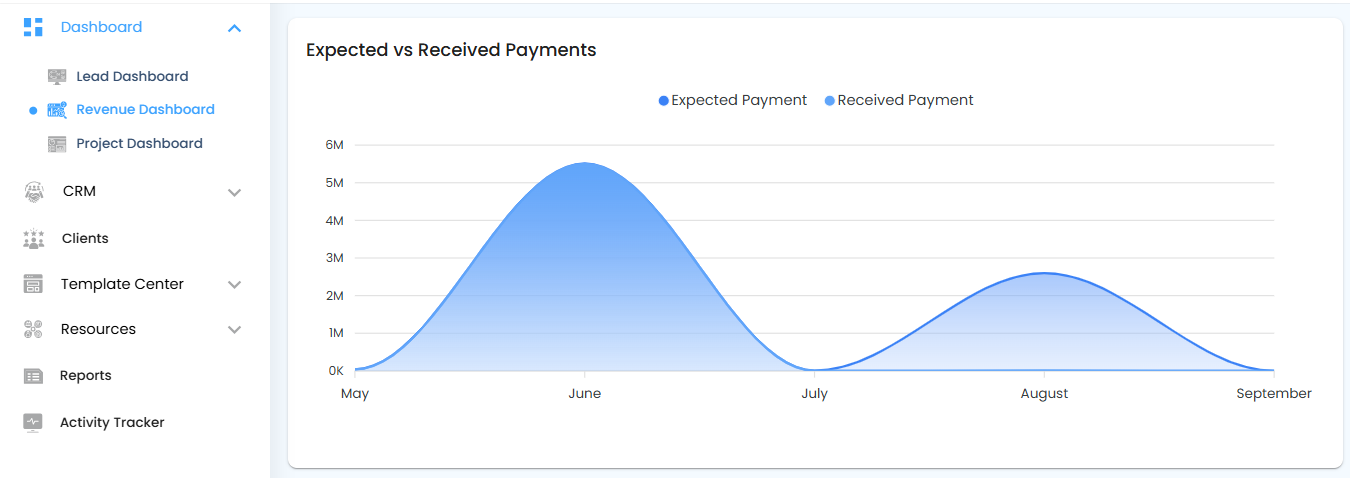
 Expected Payments vs Received Payments Graph
The Expected Payments vs Received Payments graph provides a clear comparison between the total amount invoiced and the actual amount received. It helps in tracking cash flow and identifying gaps between projected income and received payments.
Expected Payments – Represents the total amount of all invoices issued to clients.
Received Payments – Shows the actual amount collected against those invoices.
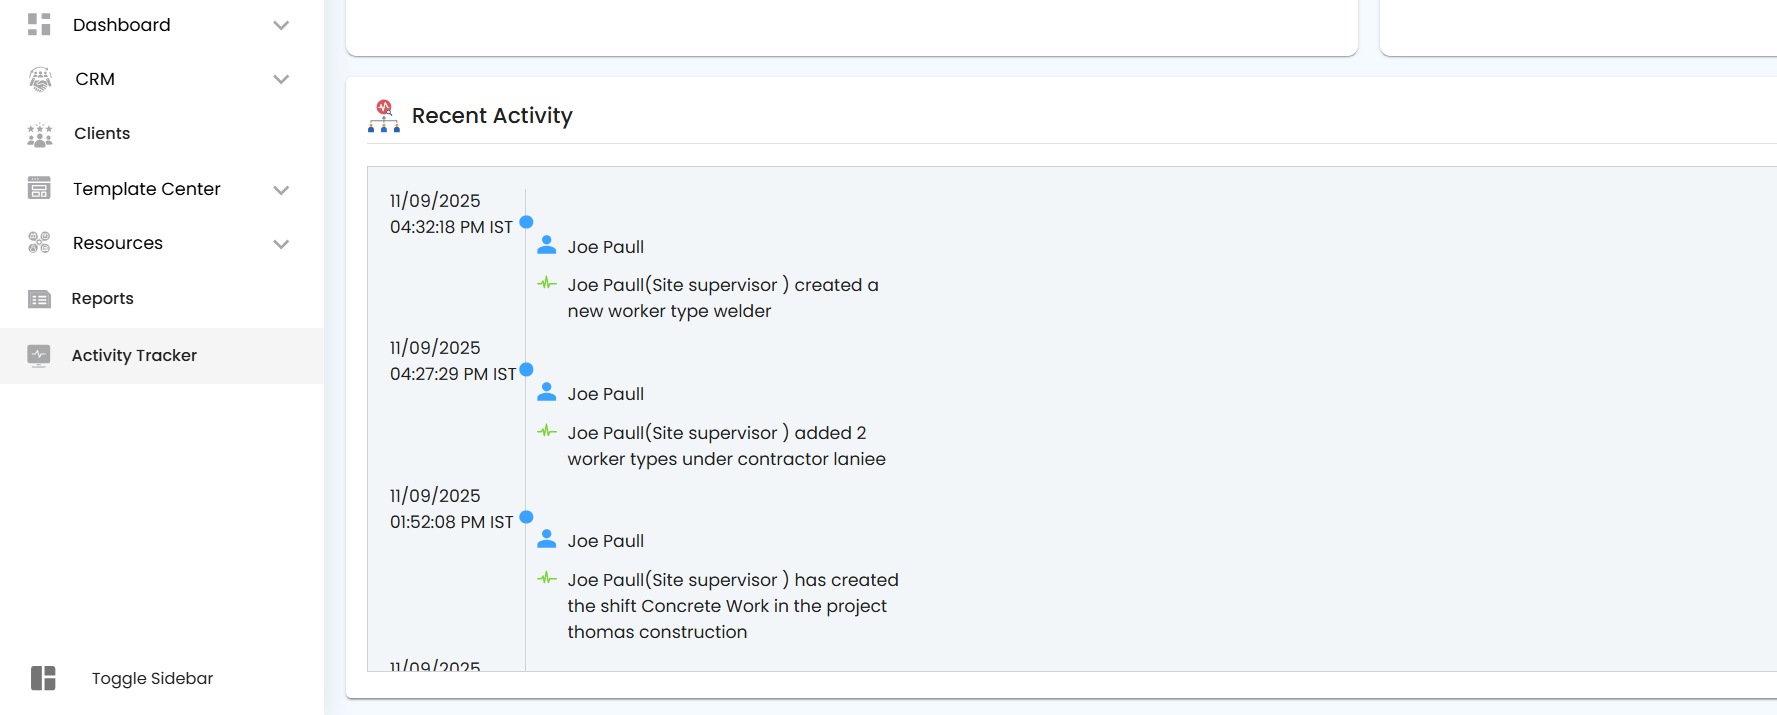
 Recent Activity:
The Recent Activity card shows the latest actions within the organization, along with the date, time, and time zone, helping you stay updated on recent changes and activities.
Was this article helpful?
That’s Great!
Thank you for your feedback
Sorry! We couldn't be helpful
Thank you for your feedback
Feedback sent
We appreciate your effort and will try to fix the article