Leads Report – Turning Data into Direction
- Think of the Leads Report in IntoAEC as your project’s dashboard for opportunities—a place where every lead, metric, and detail comes together to guide smarter decisions. From tracking who’s handling what to understanding potential business value, this report keeps your pipeline clear and actionable.
- No more scattered updates or missed follow-ups. With everything structured in one place, you can see progress at a glance and focus on what really matters—turning leads into wins.
Pro tip: Review the Leads Report regularly to spot patterns—like which sources bring the strongest leads or how long transitions take. These insights help sharpen your strategy and improve conversions.
Navigating to the Leads Report – Quick Access
Getting to your Leads Report takes just a couple of clicks.
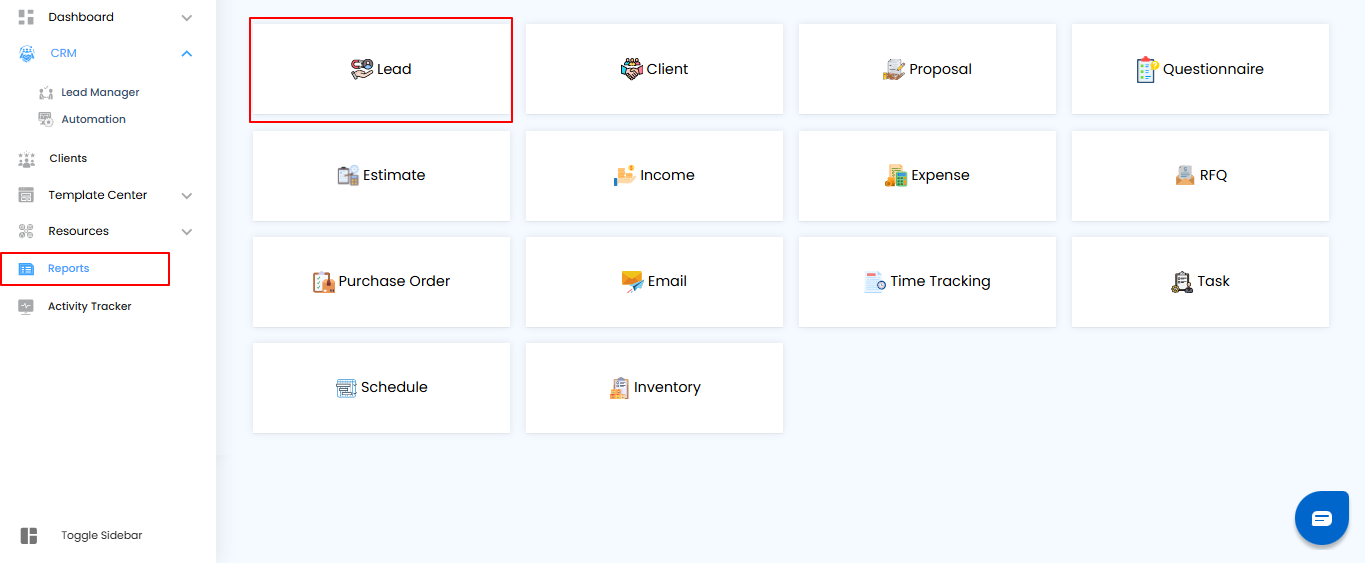
- Go to Reports – Open the main menu and head over to the Reports section.
- Select Leads Report – Click on Leads Report to open your full lead tracking dashboard—complete with details, metrics, and progress at a glance.
Pro tip : Bookmark the Leads Report page if you check it often. It saves time and keeps critical insights only one click away
Applying Filters to Search for Leads
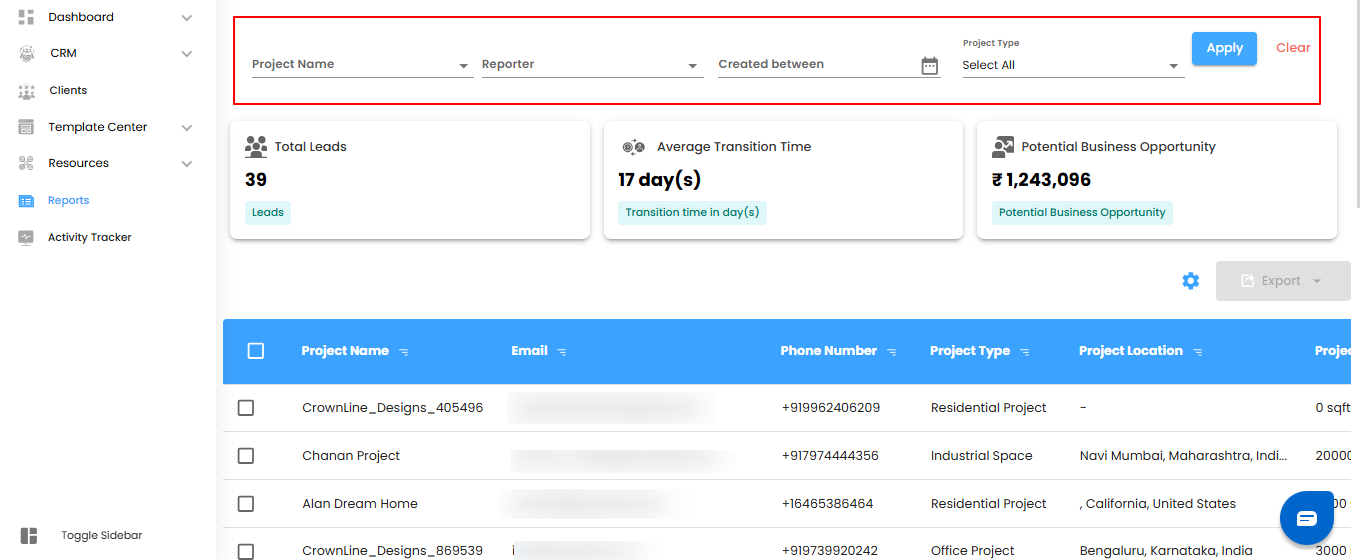
In the Leads Report section, you can quickly narrow down results using filter options.
- Project Name – Select the project from the dropdown list (manual entry is not allowed).
- Assignee – Choose the person responsible for the lead.
- Created Between – Pick a date range to filter leads by creation date.
- Project Type – Select the project category (Residential, Commercial, Industrial, etc.).
- Click Apply to view the filtered results. To reset and see all leads again, click Clear.
Pro Tip: Use filters to focus on specific projects or assignees—this makes lead tracking faster and more efficient.
Dashboard Insights – Your Leads at a Glance
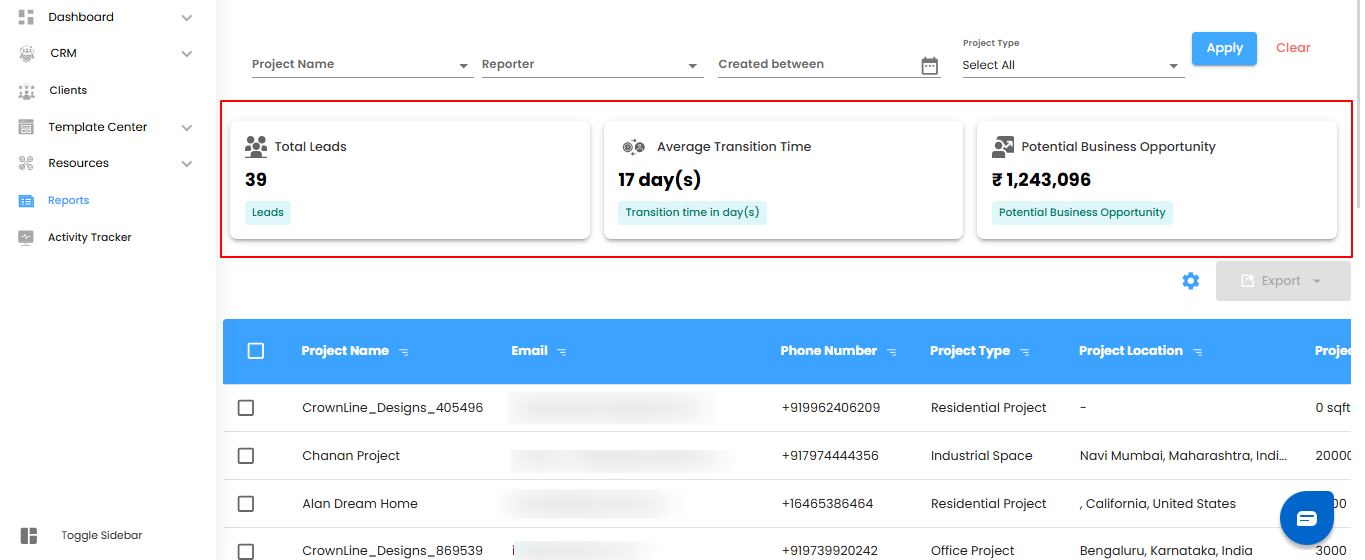
The Dashboard gives you a quick overview of all your leads, helping you stay on top of progress, performance, and potential opportunities.
What You Can See Here
- Total Leads – Displays the total number of leads created in the system, helping you track lead volume over time.
- Average Transition Time – Shows the average time leads take to move from one stage to another in the sales or project pipeline.
- Business Potential Opportunity – Calculates the total estimated budget for all projects based on current leads, providing insight into potential revenue.
How to Access the Dashboard
- Open the Leads Report – From the sidebar, click Leads to view the report.
- View Key Metrics – The top section of the report displays Total Leads, Average Transition Time, and Business Potential Opportunity.
Pro tip: Regularly check these metrics to monitor lead flow, identify bottlenecks, and estimate potential revenue accurately.
Viewing Lead Details – Your Leads in a Table
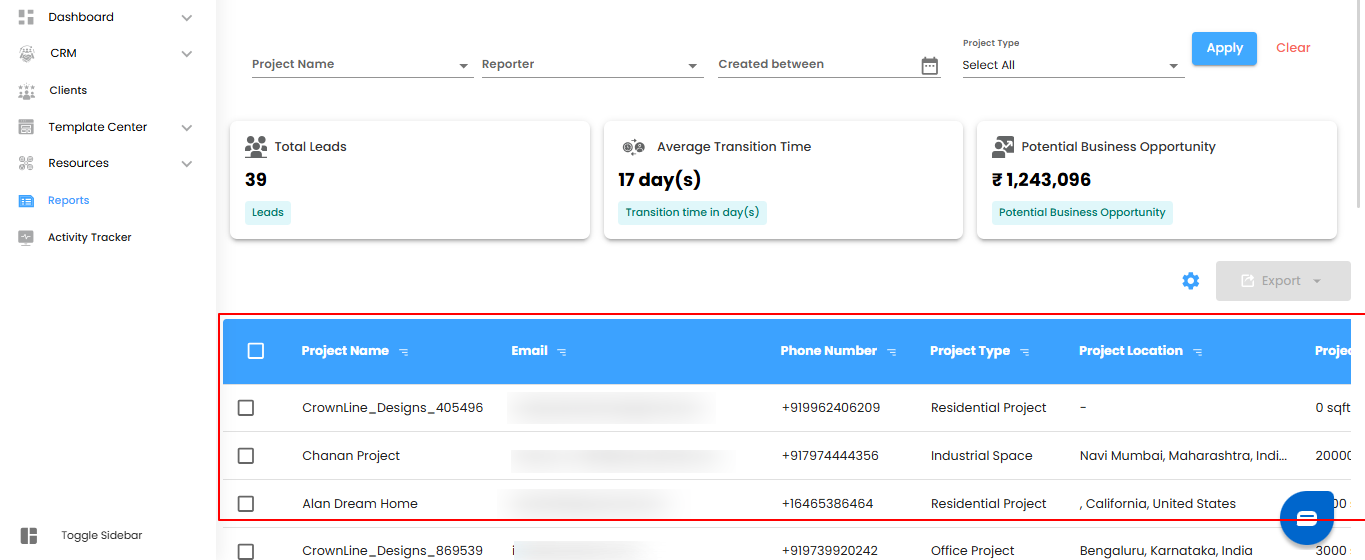
Below the Dashboard, the Leads Report Table provides a detailed view of all leads in a clear, organized format.
What You Can See Here
- Project Name – The name of the project associated with the lead.
- Project Type – The category of the project (Residential, Commercial, etc.).
- Project Area – The size or scope of the project.
- Project Location – The location of the project.
- Project Status – The current status of the project (e.g., Scheduled Meeting, New, Connected, Proposal Sent).
- Assignee – The person responsible for managing the lead.
- Email & Phone Number – Contact information for the lead.
- Created Date – The date when the lead was added to the system.
Pro tip: Use the table to quickly assess project details, monitor lead progress, and stay on top of assignments.
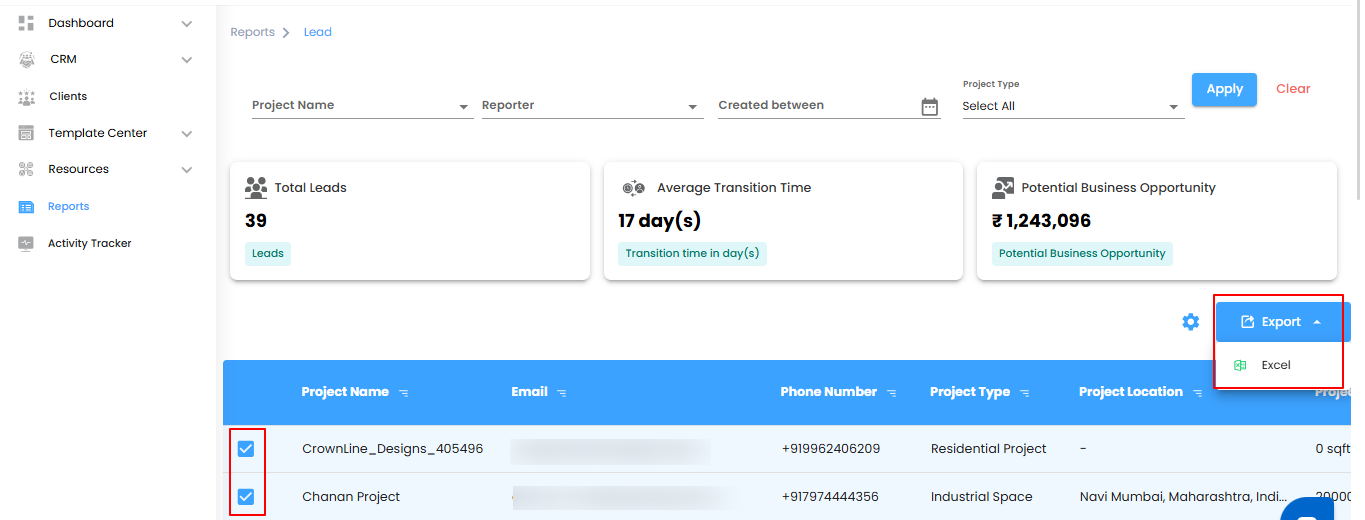
Bulk Selecting and Exporting Lead Details
The Leads Report Table allows you to manage multiple leads efficiently with bulk actions.
How to Do It
- Select Multiple Leads – Check the boxes next to the leads you want to include.
- Export Lead Details – Click the Export button to download the selected data.
- Save and Analyze – The data is exported in Excel format, making it easy to analyze, share, or keep for records.
Pro tip: Use bulk export to quickly generate reports or maintain offline records without manually handling each lead.
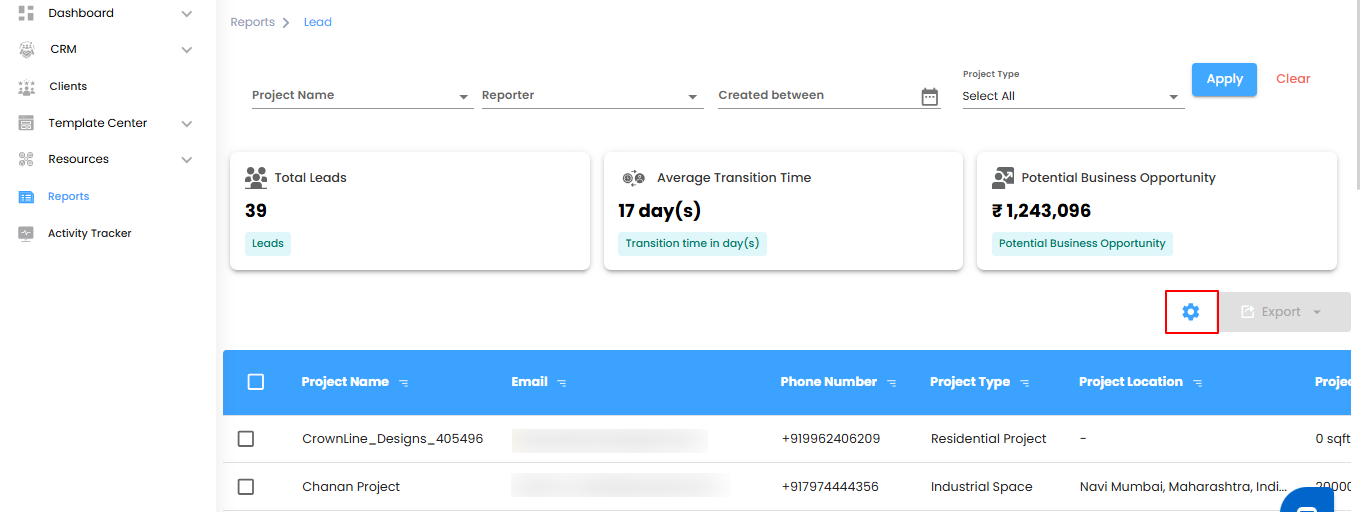
Configuring Lead Report Automation in IntoAEC
Automate your Lead Reports once and let the system handle reporting for you.
How to Set It Up
Open the Automation Settings – Click the Configure Report Automation icon to open the Lead Report Automation popup.
Pro tip: Automating reports ensures consistent updates without manual effort, saving time and reducing errors.
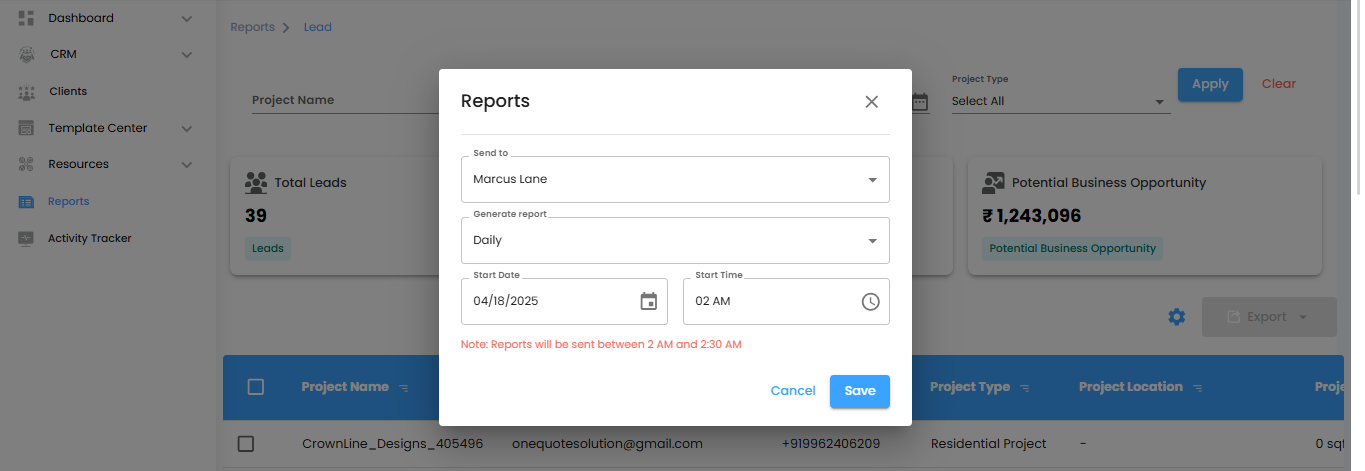
Configuring Lead Report Automation – Next Steps
Select the Recipients
Use the Send To dropdown to choose the users who should receive the automated lead reports.
Choose the Report Frequency
Use the Generate Report dropdown to set how often reports should be sent:
- Daily (default) – The report is generated within one hour of the selected time. For example, if the time is set to 6:00 PM, the report will be generated between 6:00 PM and 6:59 PM.
- Weekly – A report covering the current week will be sent at the same time and day the following week.
- Monthly – A summary of the current month will be generated and sent on the same day and time as the next month.
Pro tip: Choose the frequency based on how often your team needs updates—daily for active projects, weekly for regular tracking, or monthly for high-level summaries.
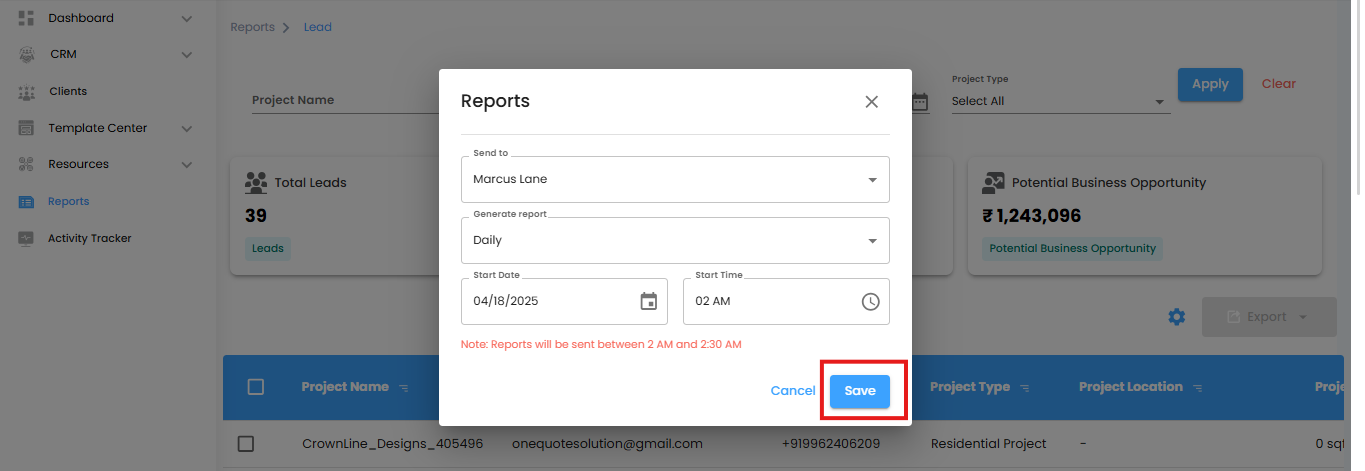
Finalizing Lead Report Automation
- Set the Start Date and Time
- Select the Start Date and Start Time for when the automation should begin.
- Make sure a Start Time is selected so the reports are generated as scheduled.
- Save or Cancel
- Click Save to activate your report automation settings, or click Cancel to discard any changes.
Pro tip: Double-check the start date and time to ensure reports are delivered exactly when needed.
Leads Report – IntoAEC
The Leads Report helps you manage and analyze project leads efficiently, giving you the insights needed to make informed business decisions.
Why It’s Useful
- Track Lead Progress – Monitor every lead’s status, project details, and assigned team members in one place.
- Measure Performance – Key metrics like Total Leads, Average Transition Time, and Business Potential Opportunity provide a clear view of progress and revenue potential.
- Find Leads Quickly – Filters and search options make it easy to locate specific leads by project type, status, assignee, or creation date.
- Streamline Reporting – Export lead data in Excel for analysis, or automate reports to keep your team updated automatically.
Pro tip: Use the Leads Report as your central hub to stay organized, monitor progress, and make data-driven decisions efficiently
Was this article helpful?
That’s Great!
Thank you for your feedback
Sorry! We couldn't be helpful
Thank you for your feedback
Feedback sent
We appreciate your effort and will try to fix the article