Your project's complete money story on one screen. See what you've invoiced, what's been received, what you've spent, and whether you're making a profit.
What you can do here
- See income, expenses and profit/loss side by side
- Track every invoice and expense entry with its amount, due date and status
- Filter the report to focus on the records you need
- Export financial data for reviews, audits or sharing
Pro tip: Start here when you need the big picture. Use the Income and Expense reports when you want to dig into one side.
Open the Financials Report
- Go to Reports in the main menu.
- Click Financials.
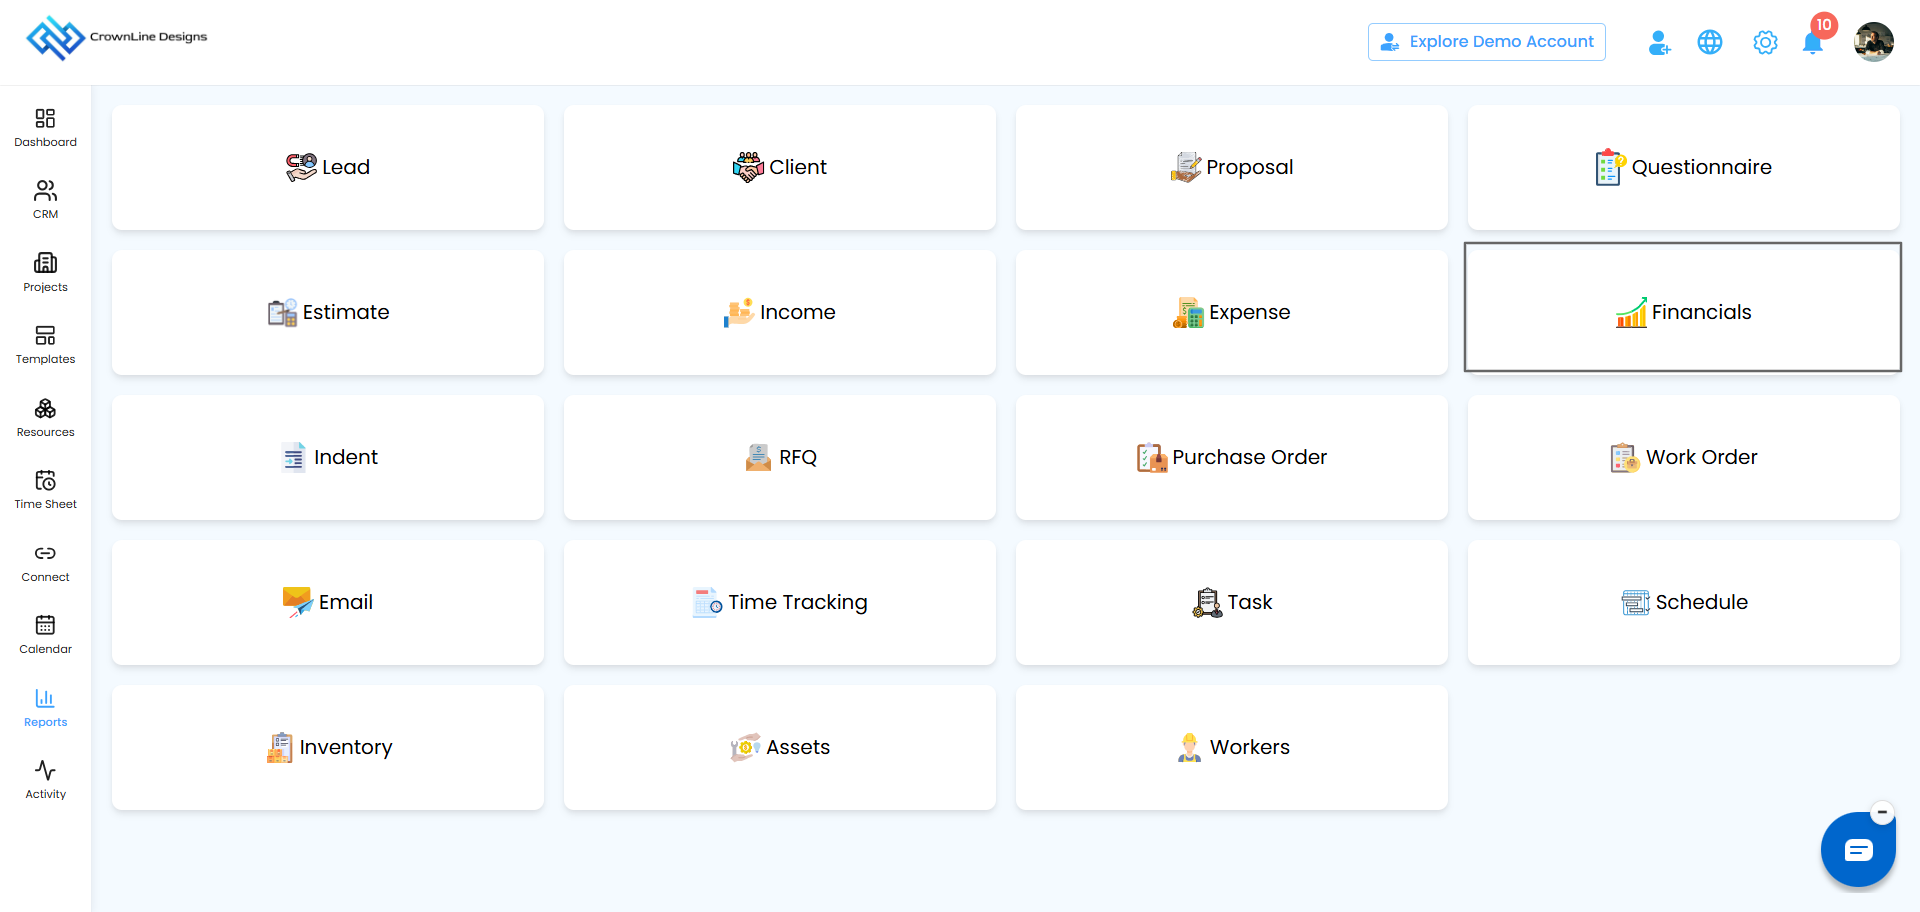
Dashboard metrics
Four cards at the top give you an instant financial health check.
| Metric | Shows |
|---|---|
| Total Invoiced Amount | Everything you've invoiced to clients |
| Total Received Amount | Payments collected so far |
| Total Expenses | Everything you've spent |
| Profit/Loss | Your net profit: Total Received Amount minus Total Expenses |
[Screenshot FN-02: The four metric cards at the top of the Financials page]
Pro tip: Profit/Loss is based on money actually received, not money invoiced. A large gap between Invoiced and Received is a cue to chase payments.
Filter the report
- Click Filter in the top-right corner of the page.
- Choose the filters you need.
- Click Apply to update the report, or Clear to see all records again.
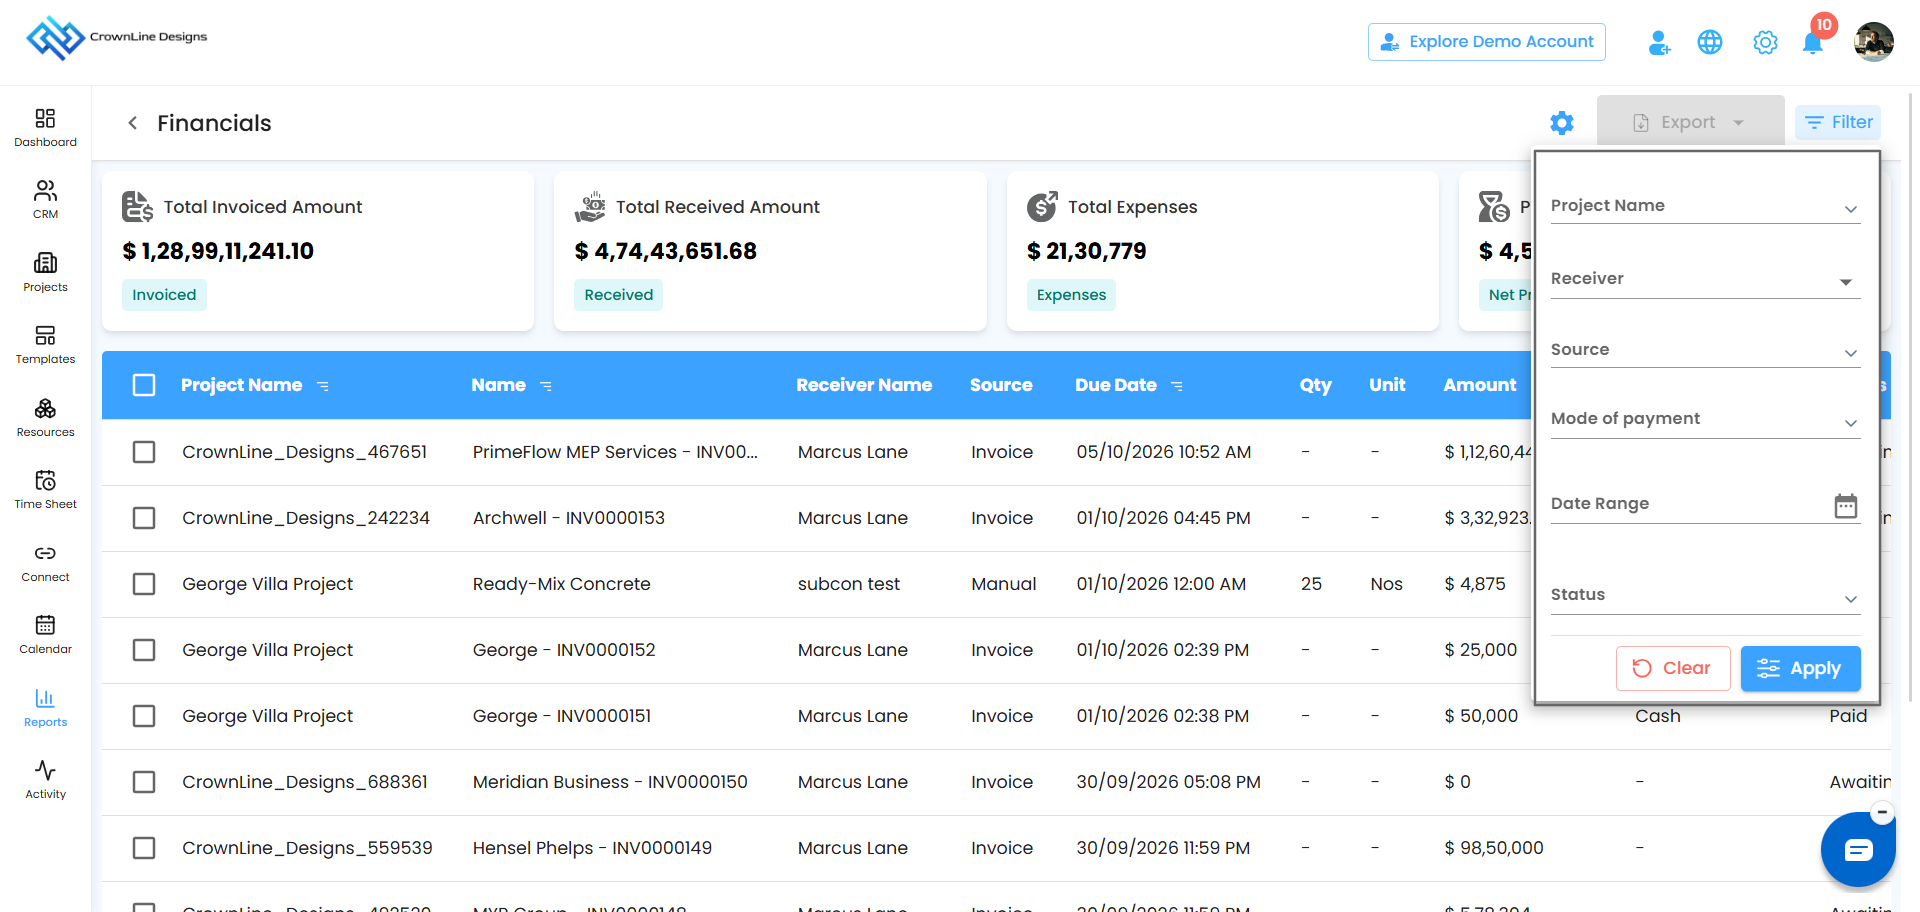
Pro tip: Filter by a single project to see that project's own profit/loss at a glance.
The financials table
Every invoice and expense entry, in one ledger.
| Column | Shows |
|---|---|
| Project Name | The project the entry belongs to |
| Name | The entry name, such as a client invoice or a material |
| Receiver Name | The person or party linked to the entry |
| Source | Where the entry came from: Invoice or Manual |
| Due Date | When payment is due |
| Qty / Unit | Quantity and unit, for manual entries |
| Amount | The value of the entry |
| Mode of Payment | Cash, Bank Transfer, and so on |
| Status | Paid or Awaiting Payment |
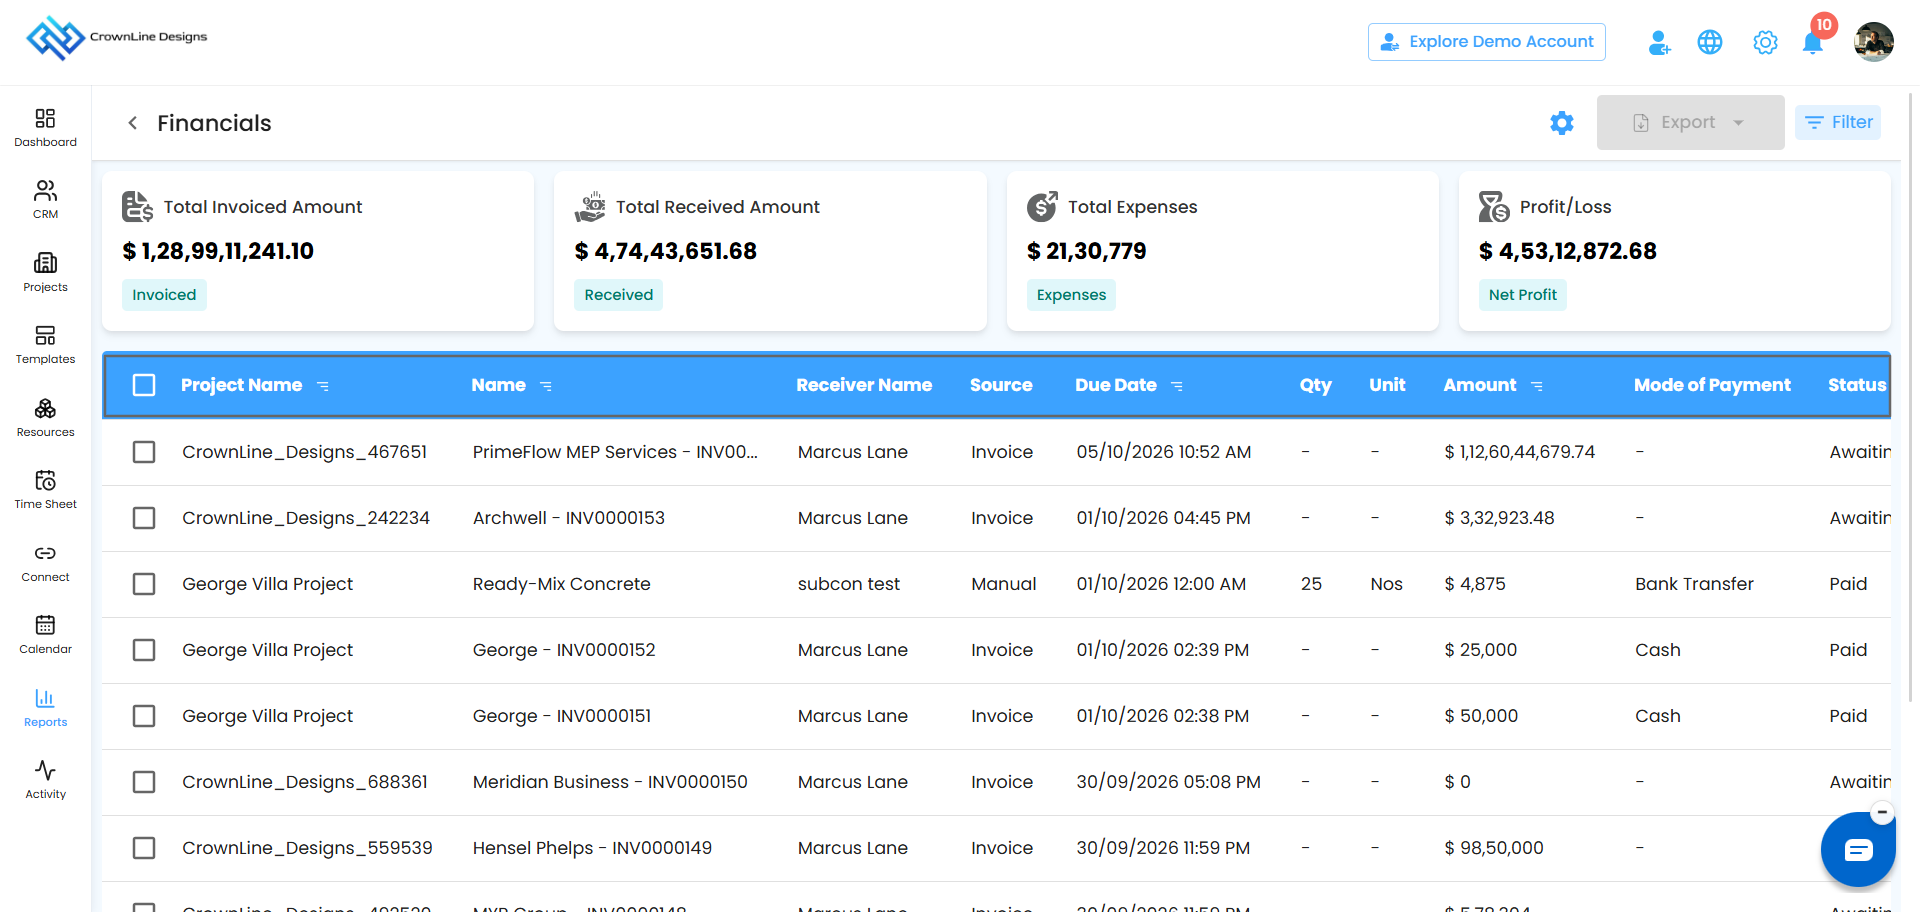
Pro tip: Sort by Project Name, Name, Due Date or Amount using the icon next to each column heading.
Select and export
- Tick the entries you want, or tick the box in the header to select all.
- Click Export.
- The data downloads as an Excel file.
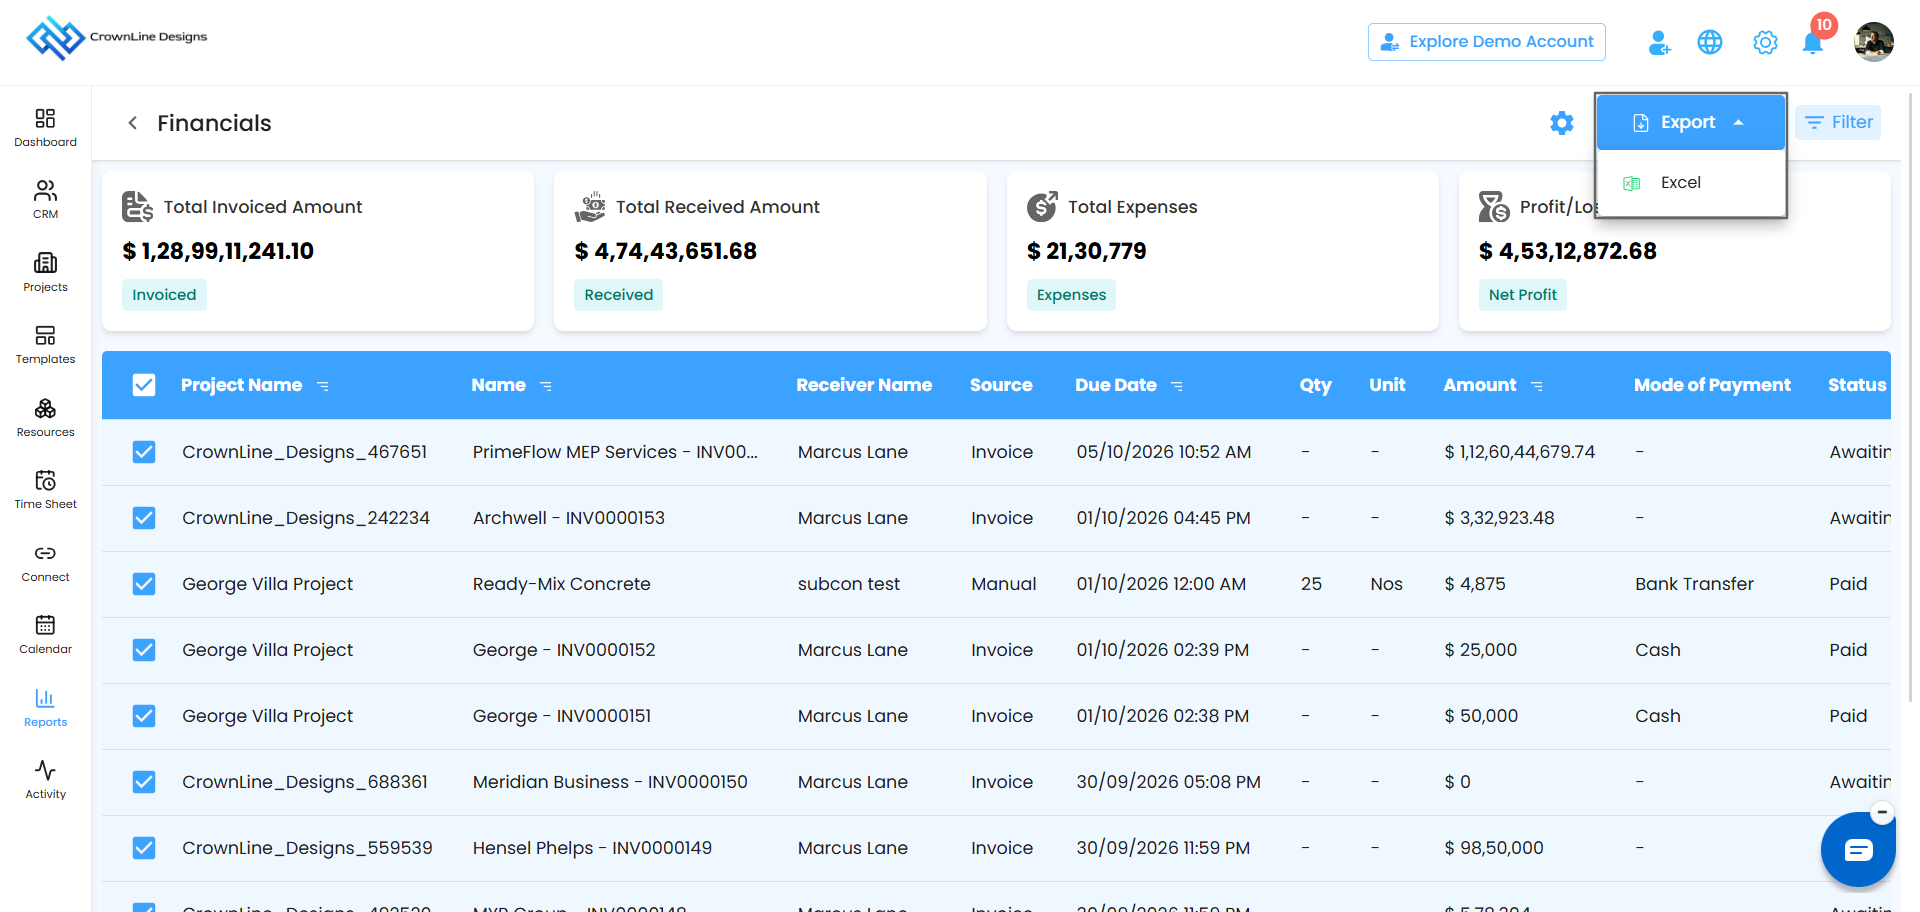
Pro tip: Filter first, then select and export. You get a focused file ready for review meetings.
Automate the report
Set it up once and the financial summary arrives on schedule.
Click the Configure Report Automation icon (the gear icon next to Export).
In the popup, choose recipients from Send To.
Pick a frequency from Generate Report:
- Daily (default): sent within an hour of your chosen time. If you set 6:00 PM, it arrives between 6:00 and 6:59 PM.
- Weekly: covers the week and is sent at the same day and time the following week.
- Monthly: covers the month and is sent on the same day and time next month.
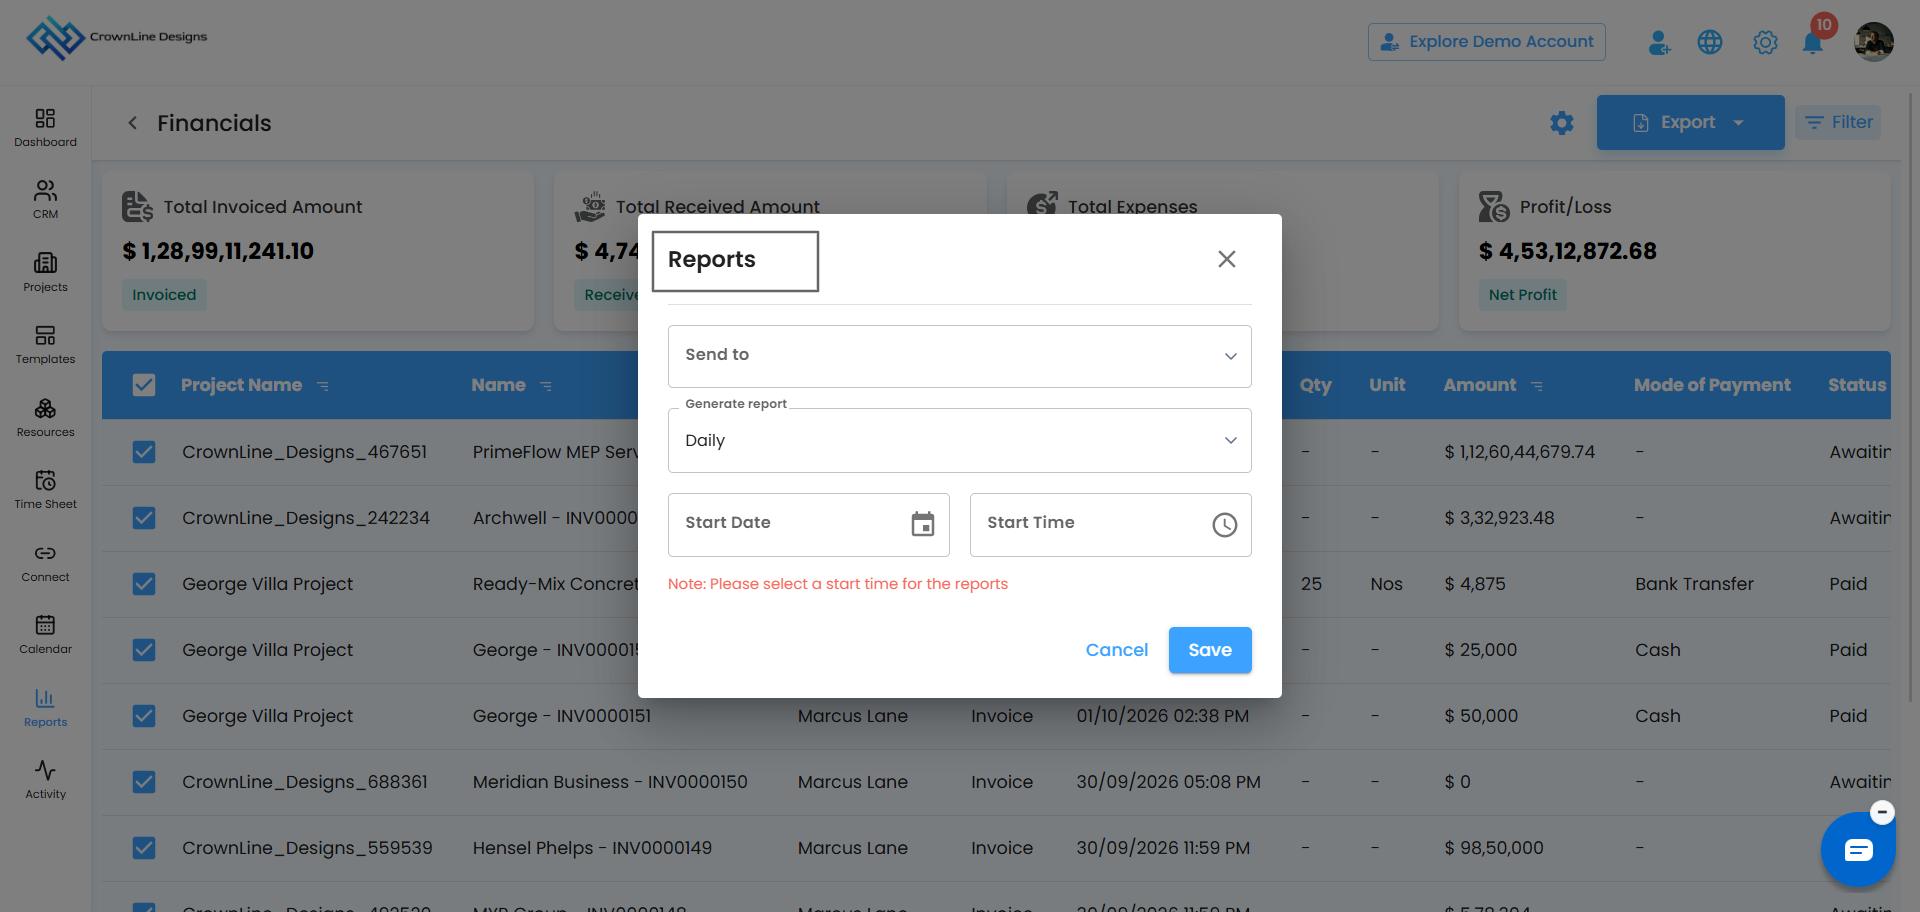
Set the Start Date and Start Time. The start time is required, so reports won't go out without it.
Click Save to activate, or Cancel to discard.
Pro tip: A monthly Financials report makes a ready-made summary for leadership.
In short: The Financials Report brings income, expenses and profit/loss together on one page, with filters, export and automation to keep your project finances in view.
Was this article helpful?
That’s Great!
Thank you for your feedback
Sorry! We couldn't be helpful
Thank you for your feedback
Feedback sent
We appreciate your effort and will try to fix the article